COVID-19 Impacts on Rent Prices in North Carolina
Report
Introduction:
For this research project, we will be investigating how the COVID-19 pandemic impacted fair market rents throughout the state of North Carolina. The COVID-19 pandemic delivered a huge blow to the economy and as a result there has been a steady increase in inflation despite pay rates remaining roughly the same (Bernstein and Tedeschi). This has greatly increased the cost of living with rent prices skyrocketing in multiple states (Bernstein and Tedeschi).
As proud Cameron Crazies, we want to analyze the extent of COVID-19’s impact of rent prices in our own home state of North Carolina. We will compare the FMR prices of zero-bedroom, one-bedroom, two-bedroom, three-bedroom, and four-bedroom across different North Carolinians counties from 2020-2023.
We will use data collected by the Department of Housing and Urban Development’s Office of Public Development and Research (HUD’s PD&R). HUD PD&R Data collection started in 1983 based on surveys of local housing markets. Now, housing authorities conduct surveys on their behalf, along with accepting telephone or mail surveys. Their full collection of data is divided by year, then state, and then county. For the purposes of our project, we only included data from North Carolina to compare between NC counties. Our data set’s variables include state, year, county name, number of bedrooms, and Fair Market Rent (FMR) price. FMR is the amount an individual is likely to pay for rent in a particular area based on the term length listed by the landlord (HUD). They “are estimates of 40th percentile gross rents for standard quality units within a metropolitan area or nonmetropolitan county.” In addition, the “year” variable for FMR’s is based off fiscal year, which is from October 1 of the previous year to September 30th of the current year (for example FY 2020 consists of data from 10/1/19 to 9/30/20).
Ethical concerns may involve the tenants in the property being disturbed by survey collectors or numerous telephone calls requesting for surveys. Another issue with privacy could be that tenants may not want everyone to know the rent prices of the area they live in. There is also an ethical concern regarding the areas and individuals being surveyed and how those results could alter rent prices alongside inflation.cFor our hypothesis, we predict that most North Carolina counties saw an increase in 20% in Fair Market Rent Prices.
For our hypothesis, we predict that most North Carolina counties saw an increase in 20% in Fair Market Rent Prices.
Literature Review:
https://usafacts.org/articles/where-are-rents-rising-post-covid-19/
The article titled, “Where are rents rising post COVID-19?,” does an overview of rent changes in the U.S. and then discusses the county and zip codes with the highest rent increase. It looks closer at Arizona and San Francisco, finding that Maricopa and Pinal counties in Arizona have the highest rent increase from 2020-2023 and that San Francisco has large rent differences by zip code. This literature also discusses in-depth the functions of FMR and how they measure final rent prices. This reading shows that COVID-19 increased rent prices but also had some outliers of counties with decreasing rent price changes. Compared to this article that reserached FMR changes throughout the U.S., we will focus on analyzing the rent price changes in North Carolina. USA Facts also has adjusted for inflation in which our research does not count for inflation.
Data:
Below is an explanation of the variables we will use to create our visualizations and models. Our variables were derived from a pivoted version of the Department of Housing and Urban Development’s Office of Public Development and Research data set for the years 2020 through 2023.
| Variable Name | Explanation |
|---|---|
| fmr | The fair market rent as described above for a specified number of bedrooms and year. |
| bedrooms | The bedrooms variable indicates the number of bedrooms for a specific fair market rent value. |
| countyname | The county name for a specific fair market rent value. |
| year | The fiscal year for which data used to calculate the fair market rent value was collected. |
| state_alpha | The state for a specific fair market rent value. In our analysis, we focused on North Carolina, so all of our observations had a state_alpha equal to “NC”. |
| fmr_pct | fmr_pct is a variable that we calculated in our analysis to use in our map graph. It represents the average change in fair market rent from 2020 for a specified year by county (irregardless of # bedrooms) . |
Methodology:
Did rent increase in your county after COVID-19?
North Carolina counties where fair market rent increased from 2020 to 2023 1
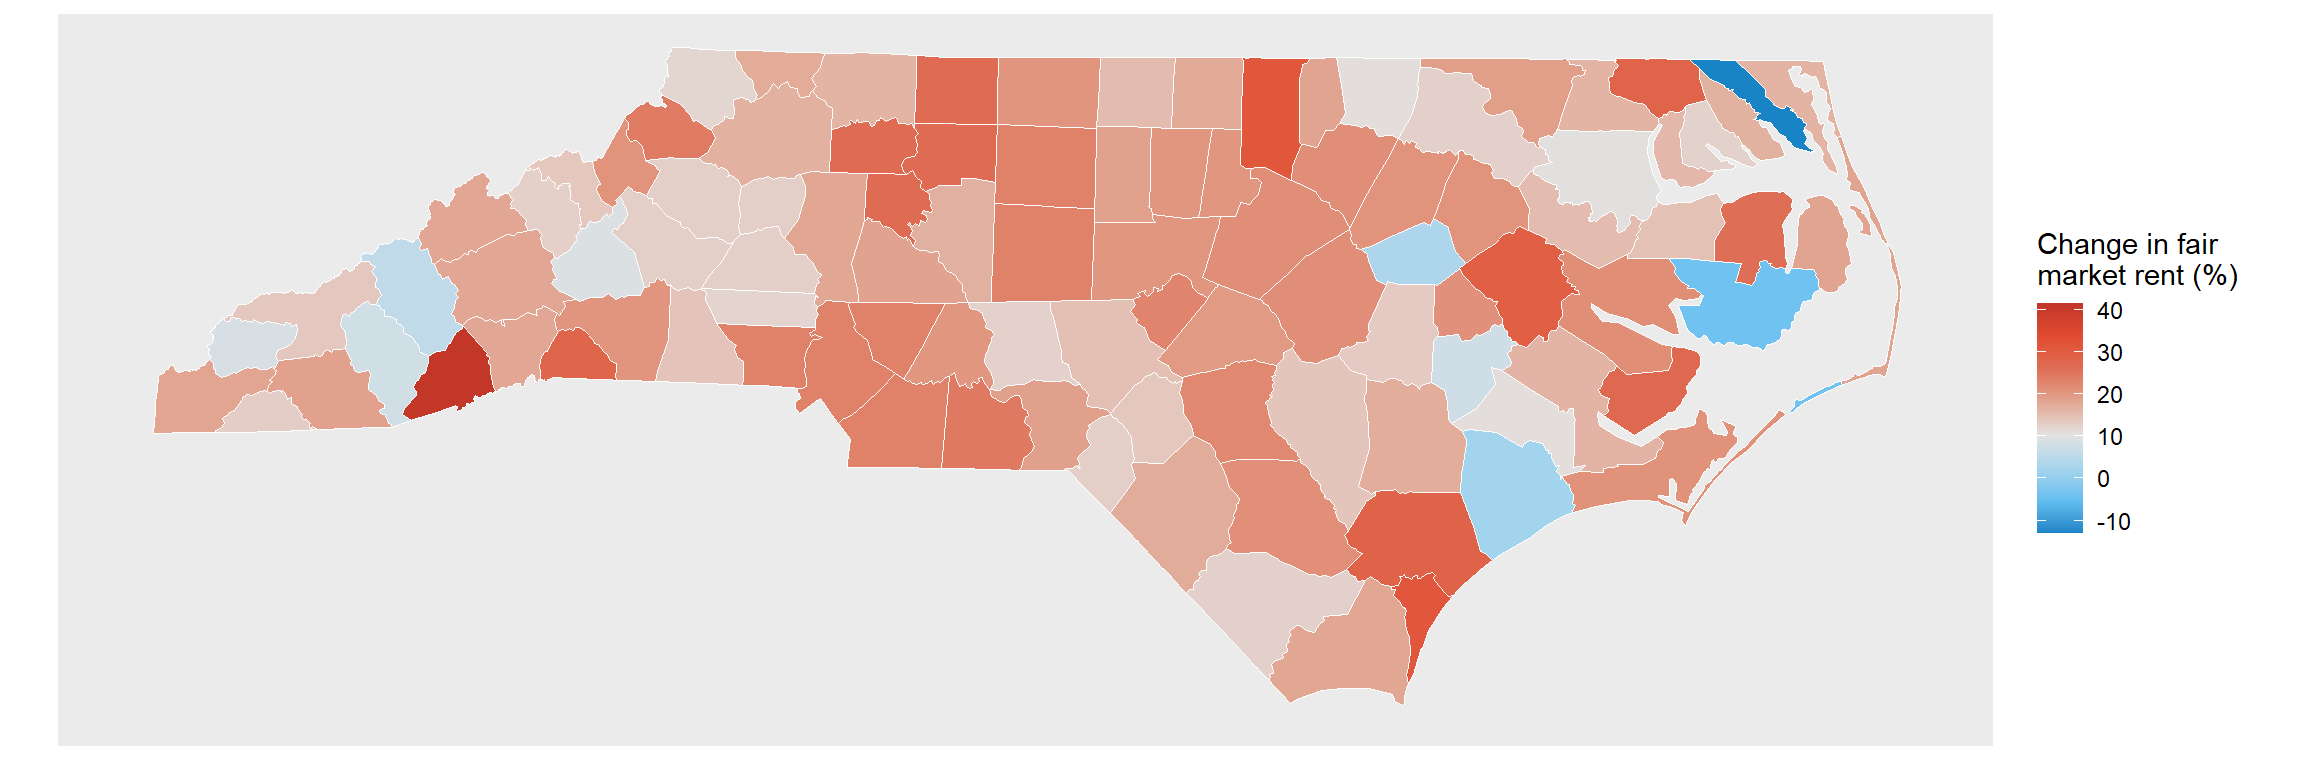
Which counties in North Carolina had the largest rent increases after COVID-19?
North Carolina counties with fair market rent increasing by 20% or more from 2020 to 2023
| County Name | Change in Fair Market Price (%) |
|---|---|
| Transylvania County | 41.52622 |
| Granville County | 31.38713 |
| New Hanover County | 31.31379 |
| Pitt County | 29.45726 |
| Pender County | 28.69983 |
| Gates County | 28.43547 |
| Polk County | 28.25967 |
| Pamlico County | 27.26291 |
| Davie County | 26.74854 |
| Forsyth County | 26.74854 |
| Stokes County | 26.74854 |
| Yadkin County | 26.74854 |
| Tyrrell County | 26.04116 |
| Anson County | 24.55669 |
| Watauga County | 24.29775 |
| Guilford County | 23.46933 |
| Randolph County | 23.46933 |
| Cabarrus County | 23.44487 |
| Gaston County | 23.44487 |
| Mecklenburg County | 23.44487 |
| Union County | 23.44487 |
| Lee County | 22.99537 |
| Cumberland County | 22.48872 |
| Beaufort County | 21.64400 |
| Franklin County | 21.55001 |
| Johnston County | 21.55001 |
| Wake County | 21.55001 |
| Bladen County | 21.50306 |
| Greene County | 21.17567 |
| Carteret County | 21.10850 |
| Edgecombe County | 20.96983 |
| Nash County | 20.96983 |
| Avery County | 20.94036 |
| Rockingham County | 20.66583 |
| Rutherford County | 20.57969 |
| Chatham County | 20.54425 |
| Durham County | 20.54425 |
| Orange County | 20.54425 |
| Stanly County | 20.51374 |
[1] 39The table above lists all of the North Carolina counties that saw an increase in fair market rents over 20% or greater from the beginning of COVID-19 (2020) to the end of COVID-19 (2023). In total, 39 out of 100 North Carolina counties saw an increase in fair market rents of 20% or more.
Which counties in North Carolina had the largest decrease in rents after COVID-19?
North Carolina counties with fair market rent decreasing from 2020 to 2023
| County Name | Change in Fair Market Price (%) |
|---|---|
| Camden County | -12.898954 |
| Hyde County | -3.931737 |
We will use a linear regression model that looks how prices have changed in North Carolina as a result of COVID-19 and to predict future pricing if COIVD-19 pricing trends continue.
rent_averages <- rents |>
  group_by(year, bedrooms) |>
  summarize(mean = mean(fmr)) |>
  mutate(year = year - 2020)
`summarise()` has grouped output by 'year'. You can override using the
`.groups` argument.rent_averages |>
kable()| year | bedrooms | mean |
|---|---|---|
| 0 | 0 | 633.14 |
| 0 | 1 | 651.65 |
| 0 | 2 | 799.12 |
| 0 | 3 | 1062.55 |
| 0 | 4 | 1282.35 |
| 1 | 0 | 657.30 |
| 1 | 1 | 674.45 |
| 1 | 2 | 825.05 |
| 1 | 3 | 1089.86 |
| 1 | 4 | 1312.96 |
| 2 | 0 | 684.60 |
| 2 | 1 | 708.88 |
| 2 | 2 | 864.77 |
| 2 | 3 | 1134.80 |
| 2 | 4 | 1368.58 |
| 3 | 0 | 751.61 |
| 3 | 1 | 781.94 |
| 3 | 2 | 946.68 |
| 3 | 3 | 1233.93 |
| 3 | 4 | 1486.67 |
regression <- linear_reg() |>
  set_engine("lm") |>
  fit(mean ~ year + bedrooms, data = rent_averages)

regression |>
  tidy() |>
kable()| term | estimate | std.error | statistic | p.value |
|---|---|---|---|---|
| (Intercept) | 606.1204 | 13.879189 | 43.67117 | 0.0000000 |
| year | 50.3614 | 4.760523 | 10.57896 | 0.0000000 |
| bedrooms1 | 22.5675 | 16.830989 | 1.34083 | 0.2013267 |
| bedrooms2 | 177.2425 | 16.830989 | 10.53072 | 0.0000000 |
| bedrooms3 | 448.6225 | 16.830989 | 26.65455 | 0.0000000 |
| bedrooms4 | 680.9775 | 16.830989 | 40.45974 | 0.0000000 |
glance(regression)$adj.r.squared[1] 0.9925511The linear regression model above can be used to find estimate mean fair market rents based on our data, if the trend in prices continues, even as the effects COVID-19 dwindle. From the linear regression model we can write an equation to estimate the mean fair market rents based on the number of years that have passed since 2020 and the number of bedrooms for the accommodation.
\[ \widehat{fmr} = (50.36 * years\_since\_2020) + 606.12 \]
\[ +\space(22.56 * one\_bedroom) + (177.24 * two\_bedroom) \]
\[ +\space(448.62 * three\_bedroom) + (680.97 * four\_bedroom) \]
where one_bedroom, two_bedroom, three_bedroom, and four_bedroom are Boolean values that represent if the fair market rent based on the number of bedrooms.
Using the above linear regression model, we can find the estimate mean fair market rent (fmr) for a specified year and number of bedrooms. This prediction or estimate will be based on our data from 2020 through 2023 that we used in our data analysis.
For example, if we would like to predict the fair market rent of a 2 bedroom accommodation in the year 2024, we can use our linear regression model to predict the price assuming that the conditions from the years 2020 through 2023 hold:
$$ = (50.36 * 4) + 606.12 + (177.24 * two_bedroom)
\[ \]
= (50.36 * 4) + 606.12 + (177.24 * 1)
\[ \]
= 984.8 $$ In conclusion, from our linear regression model based on the mean FMRs from the years 2020 through 2023 in North Carolina, we can predict that a 2 bedroom accommodation in the year 2024 in North Carolina will have an estimate mean fair market rent of 984.8 dollars, holding all else constant.
Results:
We started with understanding the rent increases per county after COVID-19. The results of the change in fair market rent % shows that numerous counties saw an increase in rents from 2020 to 2023. One county had a 40% change in FMR, and one county had a -10% change in FRM. Most counties had a percent change of about 15-30% change. We hypothesized that North Carolina counties saw a 20% increase in fair market rents from 2020 to 2023. Our analysis showed 39 out of 100 North Carolina counties saw an increase in fair market rents of 20% or more from 2020 to 2023. Additionally, we created a linear regression to help researchers predict how fair market rents will increase in the following years if price trends that occurred during COVID-19 continue to occur.
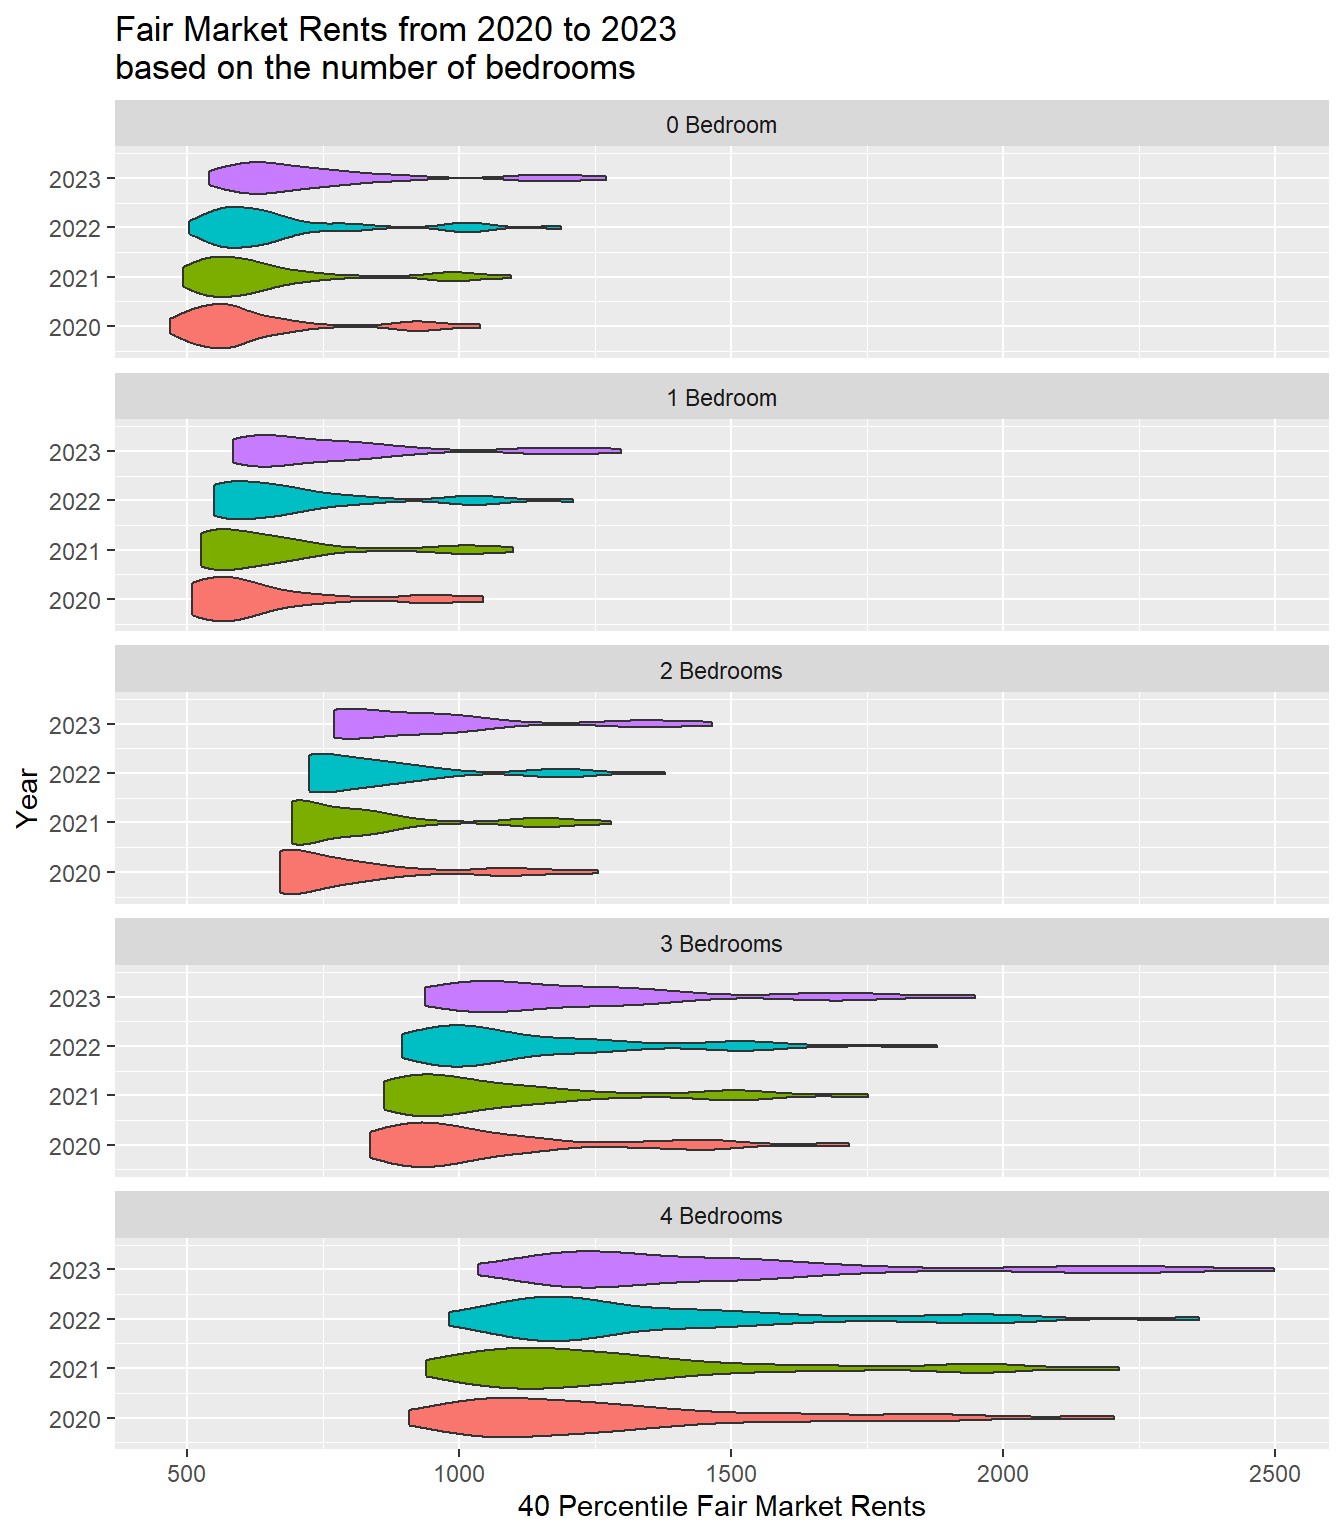
We also researched which countries in NC has the largest rent increases after COVID-19. Based on our outcomes, the research indicates that Transylvania Country has the highest change in FMR, resting at 41.53% change. On the contrary we also calculated the countries in NC with the lowest rent increases after COVID-19. Camden County with -12.9% and Hyde County with -3.93% change from the fiscal year 2020 to 2023. Furthermore, we decided to dive into the FMR from 2020-2023 based on the number of bedrooms. Based on the results, each year gradually, all housing, regardless of the number of rooms increased.
Our data analysis does not change the fair market rents increases or decreases to account for changes in inflation. We can improve on our analysis in the future by looking the fair market rents in North Carolina adjusted to account for inflation. Calculating the percent change in rents adjusted for inflation might allow us to make further conclusions, such as which counties in the state were the most impacted by COVID-19.
Sources:
https://www.huduser.gov/portal/datasets/fmr/fmrs/FY2023_code/2023bdrm_rent.odn?year=2023&cbsasub=METRO33860M33860&br_size=0
https://www.cbpp.org/research/poverty-and-inequality/tracking-the-covid-19-economys-effects-on-food-housing-and
https://www.huduser.gov/portal/datasets/fmr.html
https://www.whitehouse.gov/cea/written-materials/2021/04/12/pandemic-prices-assessing-inflation-in-the-months-and-years-ahead/
https://usafacts.org/articles/where-are-rents-rising-post-covid-19/
Footnotes
Source: HUD Fair Market Rent Data. Change in fair market rent is calculated by finding the average percent change of fair market rents from 2020 to 2023 of 0 to 4 bedroom accommodations.↩︎