Just Dance(ability)
Report
Introduction and Data
Within the music industry there is always a desire to be able to predict the next big song. Different factors will always play into whether or not a song becomes popular. We wish to explore how danceability, in particular, affects the popularity of songs. To dig a bit deeper, we want to see if the impact of danceability on popularity changes depending on which genre we are exploring. We are hoping that by exploring this correlation we can create a predictive model for popularity based on danceability. Based on the correlations we find by genre this model may be more accurate for certain genres more so than others. We have three research questions: How does danceability affect the popularity of songs? How does this vary between genres? How do other song variables influence this relationship.
Our research project will center around the Spotifyr, an open source music dataset provided by Spotify. The dataset contains around 5,000 songs from six major music categories (EDM, Latin, Pop, R&B, Rap, and Rock). These genres were selected from Every Noise, which is a visualization created and maintained by a genre taxonomist. The top four genre’s from Every Noise were used to find 20 playlists that contained relevant songs. The 5000 songs from these playlists were added to the dataset that we are analyzing. This data was gathered for a tidytuesday podcast. For each song, the data set contains general information such as the songs album, artist, release data, but also more interesting statistics on danceability, energy, and popularity. Danceability is a measure of how suitable a track is for dancing based on a combination of musical elements including tempo, rhythm stability, beat strength, and overall regularity. Danceability ratings for each song range from from 0.0 (least danceable) to 1.0 (most danceable). Energy is a measure of intensity and activity based on dynamic range, perceived loudness, timbre, onset rate, and general entropy. Energy ratings also range from from 0.0 to 1.0.The Spotify Web API was used to gain information about the songs. Spotify has twelve different features that are associated with songs. These are included within the dataset as variables.
We considered different ethical questions surrounding data collection. Specifically, we explored how songs were chosen from Spotify and acquisition bias; however, do not believe there are significant ethical concerns related to this data and data collection.
We hypothesize that there will be a positive correlation between danceability and popularity, but that correlation will differ between genres. We expect the Latin genre to have the greatest correlation. Additionally, we hypothesize that the tempo and the energy of the song (when taken into consideration with the danceability rating) will better be able to predict track popularity rating.
Literature Review
Our data set was originally found through the #tidytuesday project on GitHub. Kaylin Pavlik, a blogger, explored this dataset in various ways. She explored audio features by genre. She found that EDM tracks are the least likely to have acoustic features, but highly likely to have high energy with low valence. Additionally, through density/line plots, she found that danceability, tempo, valence, and energy had the largest differences by genre. We are building on her research by specifically analyzing the differences between danceability by genre. Our research question digs deeper into this question. Additionally, she found that Latin music was very danceable, while rock music had very little danceability. We will continue to look into the specifics of these differences through linear regression models ^[https://www.kaylinpavlik.com/classifying-songs-genres].
Amri Rohman also analyzed this dataset ^[https://rpubs.com/amrirohman/spotify-song]. She specifically looked at songs and their popularity. In 2020 she found that the most popular Spotify song was Dance Monkey. She also looked at the differences in tempo for each genre, faceted by different eras of music. She found that rap songs in the 2000s had slower tempos. We are going to build on these research questions by looking at the popularity of songs by genre faceted by dancability. We are both analyzing how different song features vary across genres.
Although other groups/people have looked into the same Spotifyr datset from tidytuesday, we are planning on looking into vastly different research questions. Because this is a large data set with many variables, there are many questions to look into. We hope to dive into popularity to analyze reasons as to why songs and genres have gained notoriety.
Methodology
We plan to answer this research question through a linear regression analysis looking at if the danceability of a song can be predictive for its popularity. This regression analysis will likely consider the energy and tempo variables in the regression analysis. This analysis will be faceted across genres as well. First, we will look at the general relationship between danceability rating and track popularity rating of songs in the data. Then, we will look into the level of this relationship in terms of different types of music by assessing genre as a variable. In addition to these basic visualizations, we will also calculate a number of summary statistics that will further assist in other analyses and allow us to better understand the data. This includes calculation of the mean danceability rating and popularity ratings specific to each genre.
Additionally, we will conduct a regression analysis to predict popularity on the basis of danceability ratings. This linear regression will have additional models looking specifically at Latin and Rap genres as well. There will also be a regression analysis conducted to assess how other variables related to a song influence the relationship between danceability and popularity. The approriate type of regression for this would be a multiple linear regression, taking into consideration multiple explanatory variables to predict track popularity. The specific quantitative variables we want to consider are energy and tempo because of their relation to danceability in this regression analysis, as considered by a similar project by Ochi et al. (n.d.). We will assess these types of regressions with both additive and interaction models to see which type of model best fits the data.
We will conduct calculations for adjusted R-squared for the linear regression and AIC for both types of regression models, in addition to mean squared error for the prediction models to confirm they are well fit. We used adjusted R-squared rather than r-squared because it takes into account the amount of variables that are being used. We were analyzing different variables in this dataset, so adjusted r-square was a better metric to use. These two metrics were used to determine the best fit model, specifically when using the many variables that we were assessing. To further assess these models created, we will split the data into training and testing data. All the models would be fitted to training data and then tested to predict popularity for the testing data. We will calculate mean squared error for the prediction for the training and testing data to determine if our models are fit at predicting for popularity on the respective explanatory variables. This MSE calculation would ensure that our model is not overfit. This will allow for adequate conclusions to be drawn from our model and subsequent usability of our models for predicting popularity of Spotify songs.
Data
# A tibble: 6 × 23
track_id track…¹ track…² track…³ track…⁴ track…⁵ track…⁶ playl…⁷ playl…⁸
<chr> <chr> <chr> <dbl> <chr> <chr> <chr> <chr> <chr>
1 6f807x0ima9a1… I Don'… Ed She… 66 2oCs0D… I Don'… 2019-0… Pop Re… 37i9dQ…
2 0r7CVbZTWZgbT… Memori… Maroon… 67 63rPSO… Memori… 2019-1… Pop Re… 37i9dQ…
3 1z1Hg7Vb0AhHD… All th… Zara L… 70 1HoSmj… All th… 2019-0… Pop Re… 37i9dQ…
4 75FpbthrwQmzH… Call Y… The Ch… 60 1nqYsO… Call Y… 2019-0… Pop Re… 37i9dQ…
5 1e8PAfcKUYoKk… Someon… Lewis … 69 7m7vv9… Someon… 2019-0… Pop Re… 37i9dQ…
6 7fvUMiyapMsRR… Beauti… Ed She… 67 2yiy9c… Beauti… 2019-0… Pop Re… 37i9dQ…
# … with 14 more variables: playlist_genre <chr>, playlist_subgenre <chr>,
# danceability <dbl>, energy <dbl>, key <dbl>, loudness <dbl>, mode <dbl>,
# speechiness <dbl>, acousticness <dbl>, instrumentalness <dbl>,
# liveness <dbl>, valence <dbl>, tempo <dbl>, duration_ms <dbl>, and
# abbreviated variable names ¹track_name, ²track_artist, ³track_popularity,
# ⁴track_album_id, ⁵track_album_name, ⁶track_album_release_date,
# ⁷playlist_name, ⁸playlist_id[1] 32833Results and Analysis
First we will plot out general popularity of songs versus their adaptability score. This will allow us to visualize how dance-ability affects song’s popularity overall in the data set.
`geom_smooth()` using formula = 'y ~ x'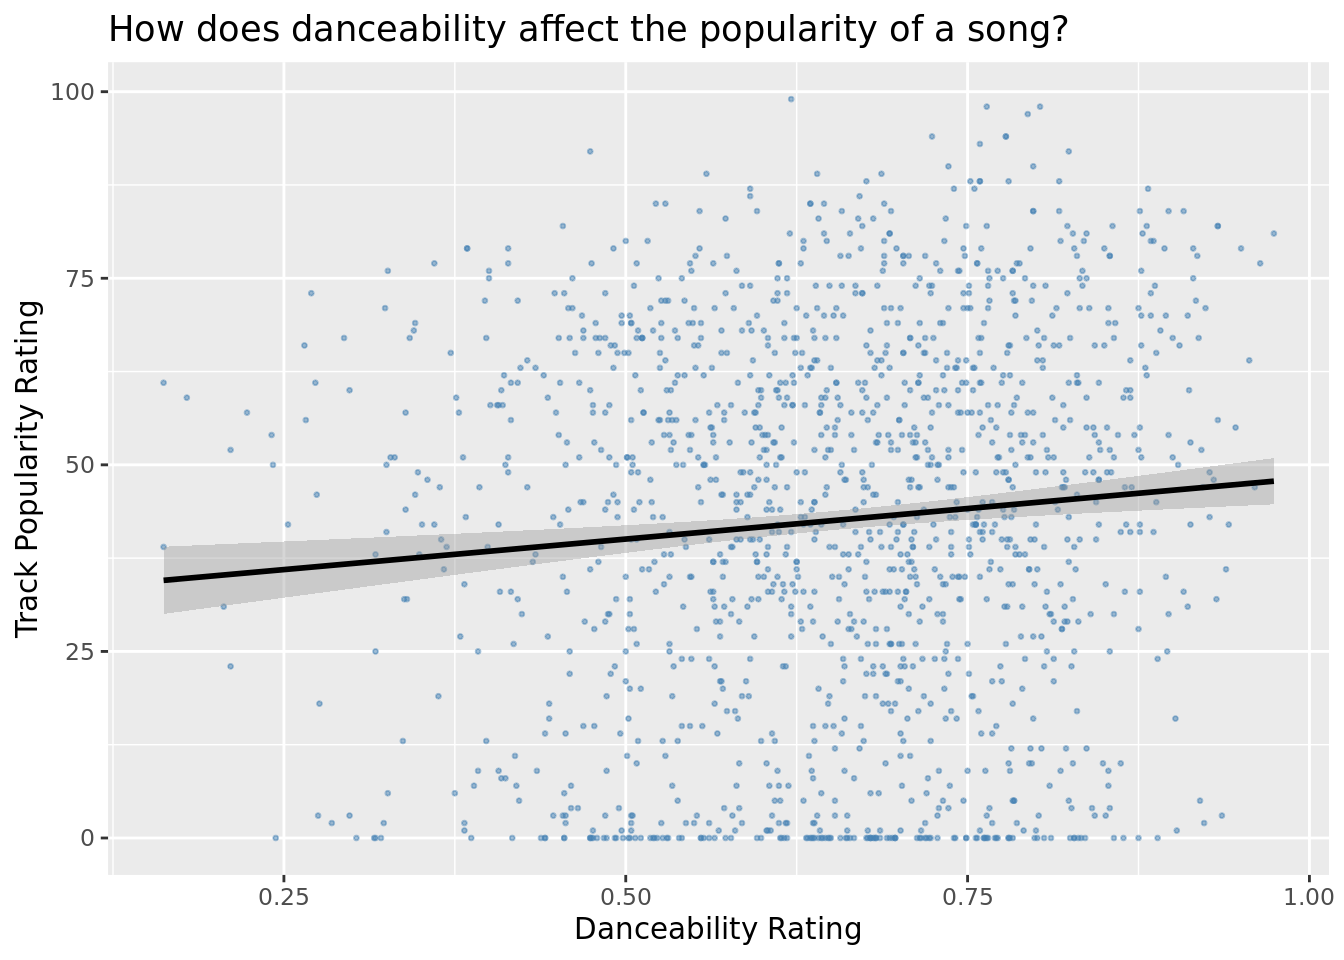
From the above plot we see a very subtle correlation between the danceability rating and its popularity for this random sampling of 1000 songs. However, with so many data points on this plot, danceability likely is not a great predictor for track popularity generally. There is no significant linear relationship between danceability and popularity.
Next, we’d like to see what this plot looks like if we facet it by the genre.
`geom_smooth()` using formula = 'y ~ x'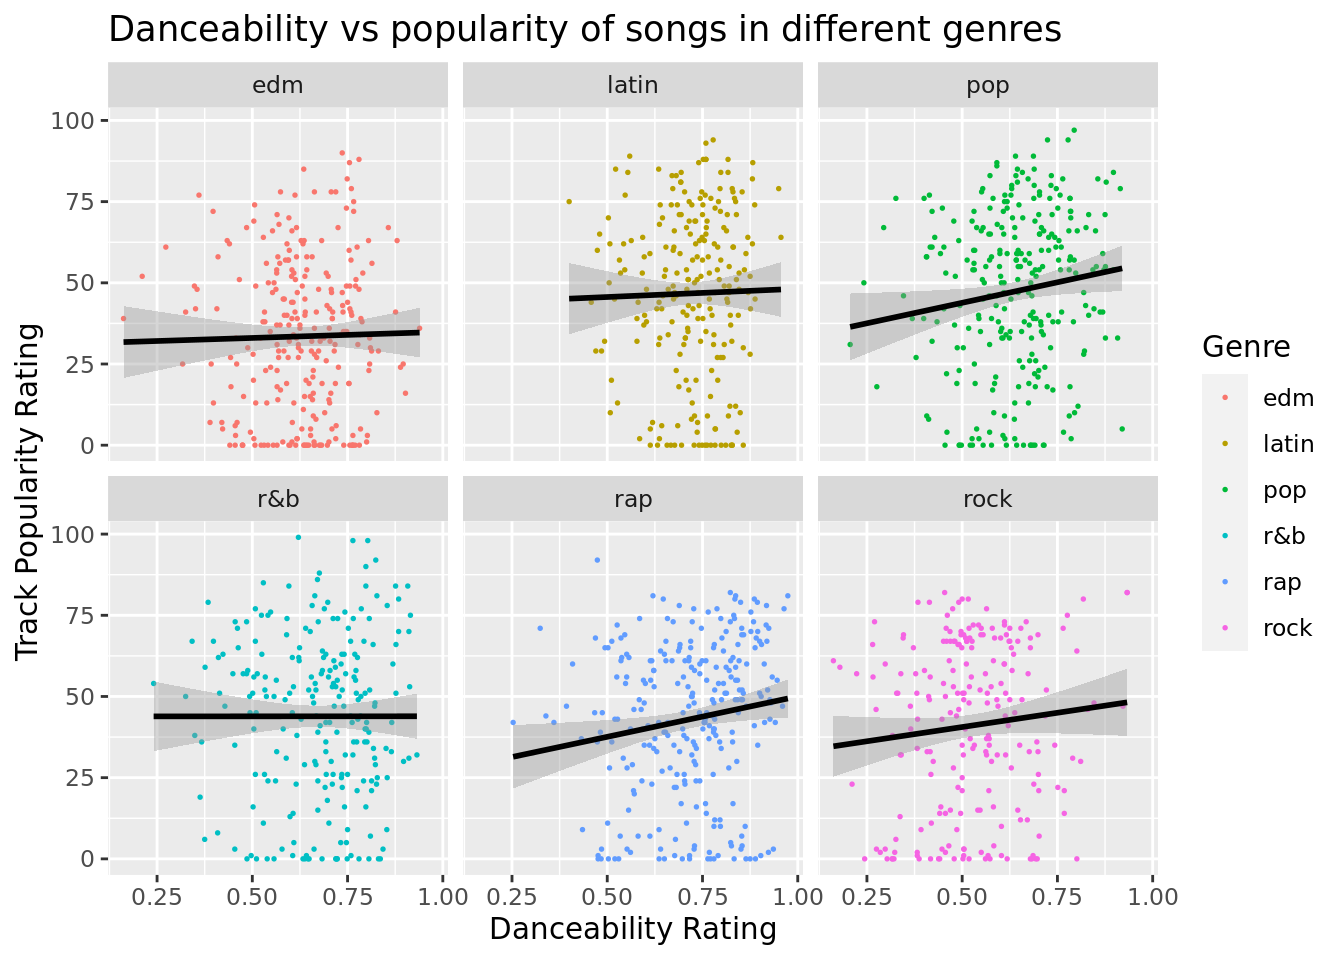
Here we can see that there is certainly a difference in how dance-ability affects the popularity of a track depending on the songs genre. Our highest correlations found here are rap and pop while we even see a slightly decreasing slope for r&b. However, its worth noting that some genres tend to have a higher dance-ability score on average such as Latin and rap. While rock has a higher correlation than some other genres, on average its songs are less dance-able than the others.
Linear Regression
Now, we’d like to train a linear regression model to predict popularity using dance-ability. We’ll train three separate models here before testing them on the testing data.
A general model that can be used for any genre.
A model that predicts how dance-ability affects the popularity of a song from the Latin genre.
A model that predicts how dance-ability affects the popularity of a song from the rap genre.
Rows: 6,570
Columns: 23
$ track_id                 <chr> "0r7CVbZTWZgbTCYdfa2P31", "7fvUMiyapMsRRxr07c…
$ track_name               <chr> "Memories - Dillon Francis Remix", "Beautiful…
$ track_artist             <chr> "Maroon 5", "Ed Sheeran", "Loud Luxury", "AJ …
$ track_popularity         <dbl> 67, 67, 67, 60, 35, 87, 56, 34, 45, 48, 74, 7…
$ track_album_id           <chr> "63rPSO264uRjW1X5E6cWv6", "2yiy9cd2QktrNvWC2E…
$ track_album_name         <chr> "Memories (Dillon Francis Remix)", "Beautiful…
$ track_album_release_date <chr> "2019-12-13", "2019-07-11", "2019-03-29", "20…
$ playlist_name            <chr> "Pop Remix", "Pop Remix", "Pop Remix", "Pop R…
$ playlist_id              <chr> "37i9dQZF1DXcZDD7cfEKhW", "37i9dQZF1DXcZDD7cf…
$ playlist_genre           <chr> "pop", "pop", "pop", "pop", "pop", "pop", "po…
$ playlist_subgenre        <chr> "dance pop", "dance pop", "dance pop", "dance…
$ danceability             <dbl> 0.726, 0.675, 0.744, 0.694, 0.467, 0.693, 0.7…
$ energy                   <dbl> 0.815, 0.919, 0.726, 0.901, 0.821, 0.678, 0.8…
$ key                      <dbl> 11, 8, 1, 1, 7, 8, 0, 1, 7, 11, 6, 9, 7, 5, 7…
$ loudness                 <dbl> -4.969, -5.385, -4.675, -4.322, -5.466, -7.15…
$ mode                     <dbl> 1, 1, 1, 0, 1, 1, 0, 0, 0, 1, 0, 0, 0, 0, 1, …
$ speechiness              <dbl> 0.0373, 0.1270, 0.0463, 0.0948, 0.0934, 0.032…
$ acousticness             <dbl> 0.072400, 0.079900, 0.039900, 0.070200, 0.007…
$ instrumentalness         <dbl> 4.21e-03, 0.00e+00, 0.00e+00, 0.00e+00, 4.41e…
$ liveness                 <dbl> 0.3570, 0.1430, 0.3740, 0.4270, 0.1310, 0.101…
$ valence                  <dbl> 0.693, 0.585, 0.687, 0.368, 0.232, 0.404, 0.4…
$ tempo                    <dbl> 99.972, 124.982, 121.985, 118.051, 122.676, 1…
$ duration_ms              <dbl> 162600, 163049, 192507, 173548, 185366, 22826…
# A tibble: 2 × 5
  term         estimate std.error statistic  p.value
  <chr>           <dbl>     <dbl>     <dbl>    <dbl>
1 (Intercept)      35.3     0.712      49.6 0
2 danceability     10.9     1.06       10.3 7.43e-25
# A tibble: 2 × 5
term estimate std.error statistic p.value
<chr> <dbl> <dbl> <dbl> <dbl>
1 (Intercept) 41.3 2.50 16.5 3.80e-59
2 danceability 7.94 3.46 2.30 2.18e- 2# A tibble: 2 × 5
term estimate std.error statistic p.value
<chr> <dbl> <dbl> <dbl> <dbl>
1 (Intercept) 25.9 1.84 14.1 3.03e-44
2 danceability 24.0 2.51 9.54 2.20e-21\(pop_{general} = 35.3 + 10.9 * danceability\)
For a 1 increase in danceability rating, there’s an estimated mean change of a song’s popularity rating (general song w/ no designated genre) by 10.9.
When danceability is 0, there is an estimated mean popularity rating of 35.3.
\(pop_{latin} = 41.3 + 7.94 * danceability\)
For a 1 increase in danceability rating, there’s an estimated mean change of a latin song’s popularity rating by up by 7.94.
When danceability is 0, there is an estimated mean popularity rating of 40.7.
\(pop_{rap} = 25.9 + 23.9 * danceability\)
For a 1 increase in danceability rating, there’s an estimated mean change of a song’s popularity rating by 23.9.
When danceability is 0, there is an estimated mean popularity rating of 25.9.
Training Data Set
Calculations of mean squared error for the training data set from predictions.
[1] 623.7248[1] 647.9394[1] 539.8089Testing Data Set
Calculations of mean squared error for the training data set from predictions.
Warning in pop_pred_general - test_data$track_popularity: longer object length
is not a multiple of shorter object length
[1] 618.2059[1] 634.6527[1] 498.709MSE Table
Summary of the mean squared error results from both training and testing data models.
| Linear Regression Models | MSE |
|---|---|
| general_dance_train | 623.7248 |
| general_dance_test | 618.2059 |
| latin_dance_train | 647.9394 |
| latin_dance_test | 634.6527 |
| rap_dance_train | 539.8089 |
| rap_dance_test | 498.7090 |
Linear Regression Model Fit Assessments
Now we’d like to assess how well the regression model explains the observed data. We will do this by calculating adjusted R squared values.
[1] 0.003989811[1] 0.00103406[1] 0.01922207| Models | R Squared |
|---|---|
| R2_general_dance | 0.0039898 |
| R2_latin_dance | 0.0010341 |
| R2_rap_dance | 0.0192221 |
Based on the adjusted R squared values, danceability rating as an explanatory variable is not a good predictor of popularity rating in general and in the latin and rap genres. The adjusted R squared values between 0.10-2.0% reveals a very low variability in popularity is explained by the regression model. It’s important to note that both the rap and dance models likely have fewer samples total than the general genre model and these can impact the adjusted r-squared results.
Now we’d like to assess how well the regression model explains the observed data using AIC values.
# A tibble: 1 × 1
  `pull(glance(general_dance), AIC)`
                               <dbl>
1                            243558.
# A tibble: 1 × 1
`pull(glance(latin_dance), AIC)`
<dbl>
1 38407.# A tibble: 1 × 1
`pull(glance(rap_dance), AIC)`
<dbl>
1 41963.| Models | AIC |
|---|---|
| AIC_general_dance | 243558 |
| AIC_latin_dance | 38407 |
| AIC_rap_dance | 41963 |
Based on AIC calculations, the latin dance model was best fit because it had the lowest AIC value at 38407, where the rap model had the second lowest AIC of 41963, and the general model had the highest AIC of 243558. AIC selects a model with the least mean squared error, so a lower value is preferable [http://www.sthda.com/english/articles/38-regression-model-validation/158-regression-model-accuracy-metrics-r-square-aic-bic-cp-and-more/]. It’s important to note that both the rap and dance models likely have fewer samples total than the general genre model and these can impact the AIC results.
These results are important given the MSE results showing that all the models were fit for both training and testing data. There were no major differences between the MSE for the models on the training and testing data. This shows that our models were not overfit - the models and their explanatory variables worked well at predicting popularity for both the trained data and on new data (testing data).
Multiple Linear Regression Models and Model Fit Assessments
Now, we’d like to train multiple linear regression models to predict popularity using dance-ability, tempo, and energy. We’ll train multiple separate models.
- An additive model for danceability rating + tempo.
- An additive model for danceability rating + energy.
- An additive model for danceability rating + tempo + energy.
- An interaction model for danceability rating * tempo.
- An interaction model for danceability rating * energy.
- An interaction model for danceability rating * tempo * energy.
Training Data
[1] 243559.2[1] 243268[1] 243258.8[1] 243561.1[1] 243268.6[1] 243257.6Testing Data
[1] 60820.16[1] 60754.63[1] 60752.95[1] 60822.01[1] 60748.93[1] 60744.13| Models | AIC |
|---|---|
| AIC_dance_plus_tempo_train | 243559.20 |
| AIC_dance_plus_tempo_test | 60820.16 |
| AIC_dance_plus_energy_train | 243268.00 |
| AIC_dance_plus_energy_test | 60754.63 |
| AIC_dance_plus_tempo_energy_train | 243258.80 |
| AIC_dance_plus_tempo_energy_test | 60752.95 |
| AIC_dance_int_tempo_train | 243561.10 |
| AIC_dance_int_tempo_test | 60822.01 |
| AIC_dance_int_energy_train | 243268.60 |
| AIC_dance_int_energy_test | 60748.93 |
| AIC_dance_int_tempo_energy_train | 243257.60 |
| AIC_dance_int_tempo_energy_test | 60744.13 |
Given that the interaction model between danceability rating, tempo, and energy resulted in the lowest AIC value (testing data = 60744.13; training data = 243257.6), it is the best fit of the ones assessed at modeling popularity of a song. However, there are very small differences for the AIC results across all the models. We excluded genre in the multiple-linear regression models because we learned that genre did not have significant impacts on our previous predictive models. This caused us to shift our focus to other variables that could potentially impact our predicative models.
MSE Calculations
[1] 604.9009Warning in mult_lin_test_6 - train_data$track_popularity: longer object length
is not a multiple of shorter object length[1] 636.1877| Interaction Model | MSE |
|---|---|
| general_dance_train | 623.7248 |
| dance_int_tempo_energy_train | 636.1877 |
| dance_int_tempo_energy_test | 604.9009 |
This results are important given the MSE results showing that all the models were fit for both training and testing data. Given that the interaction model between danceability, tempo, and energy had the lowest AIC value, this was the model chosen to conduct predictions from the training-testing data with MSE calculations. There were no major differences between the MSE for the models on the training and testing data. This shows that our models were not overfit - the models and their explanatory variables worked well at predicting popularity for both the trained data and on new data (testing data).
Discussion
Our original research questions examined the effect of danceability on different songs and how this changed by genre. We conducted an exploratory data analysis, which showed us that there was a slight positive correlation between danceability and popularity. When faceted by genre, this trend changed. Genres such as rap, pop, and rock had higher positive trendlines that showed positive correlation between danceability and popularity.
We then trained linear models to predict popularity based on danceability. This showed us that there is a positive correlation between danceability, which increases when looking by genre. The AIC values for this model showed us that the Latin genre’s model was best fit. The General model was the least fit. One limitation of this analysis is that the general model had the most variables, which could have contributed to the high AIC value, rather than model fitness.
Additionally, we calculated Mean Squared Error (MSE) values for these models. We calculated this with the training data set and with the testing dataset. The values were very similar between datasets, which confirmed that we made models that can predict popularity. We did not over fit the models based on the data, which means these models can be used more universally. We also calculated adjusted r-squared values. These showed that danceability rating as an explanatory variable is not a good predictor of popularity rating in general and in the latin and rap genres. The adjusted R squared values between 0.10-2.0% reveal a very low variability in popularity that is explained by the regression model.
We chose to calculate the adjusted r-squared over other methods because it is better fit for the multiple variables that we were exploring, where the r-squared would have been better for fewer variables. Using the three method (AIC, adjusted r-squared, and MSE) approach, we were able to determine the efficacy of the models we created. These models:
\(pop_{general} = 35.3 + 10.9 * danceability\)
\(pop_{latin} = 41.3 + 7.94 * danceability\)
\(pop_{rap} = 25.9 + 23.9 * danceability\)
They show that danceability rating increases the popularity of a song. The latin genre has a mean popularity rating of 41.3 when danceability is 0, which is the highest of the models. Danceability has the largest impact on the popularity rating for rap songs, with a 23.9 increase in popularity for every 1 unit increase in danceability rating. The general model falls between both of these ratings, representing that the latin and rap genres fall on more extreme ends of the spectrum for danceability impacting popularity.
Finally, we conducted a multiple linear regression analysis to create model fit assessments. Because our EDA had shown that genre has a small impact on popularity when faceted, we explored other variables on the general dataset: Tempo, Danceability, and Energy. One limitation of these models is that they are not faceted by genre. We explored both additive and interactive models:
- An additive model for danceability rating + tempo.
- An additive model for danceability rating + energy.
- An additive model for danceability rating + tempo + energy.
- An interaction model for danceability rating * tempo.
- An interaction model for danceability rating * energy.
- An interaction model for danceability rating * tempo * energy.
The results of these models showed that the interactive model (6) with Danceability, Tempo, and Energy had the lowest AIC. This showed that it was the best fit model to determine popularity of songs. Another interesting conclusion from this test was the impact of Energy on AIC score. Between the interactive and additive models, the ones with energy had the lowest values. In the future, it would be interesting to explore the impact of energy by genre.
We also found the mean squared error value for the test and training set for the most fit model: An interaction model for danceability rating * tempo * energy. The MSE was similar between the test and training dataset, showing that this model was not over fit for the data. The model we created can be used on other datasets to determine popularity.
Limitations
One limitation on our EDA is that we used random sampling. We did not random sample in a way that gave the same proportion of songs for each genre. This could have impacted our results if some genre’s were over included in the randomly sampled data. In the future, it would be useful to sample in a more direct way. Another limitation of our multiple linear regression is that we did not explore by genre. This would have helped us answer our research question more fully. In a future project, it would be useful to examine those results in conjunction with what we found. Our analysis could be improved with a ROC curve; however, we chose not to include one because we did not have binary variables. We had explanatory variables that were better fit to be explored with MSE. In a future experiment, it would be useful to use both methods to have a larger set of data to analyze.
One issue with the reliability of our data is the song selection process. Although it was gathered by a genre taxonomist, who is qualified in their field, it would be useful to replicate this project with other songs. There are many songs that are created each year. These results could be skewed by the year the songs were created. The music industry is constantly changing. Additionally, the tastes of listeners can be influenced by trends, movements, and other factors. A limitation of our analysis is that it does not include the year these songs were pulled from.
In the future it would be interesting to explore a new dataset with different songs. A replication of our project could be conducted with newly released songs. It would also be interesting to explore other variables in this dataset such as loudness, key, and tempo. Finally, it would also be interesting to explore other subgenres that are included in the dataset. These could have different complexities that were not captured by the larger categories.