Warning: package 'ggplot2' was built under R version 4.2.2
Warning: package 'tidyr' was built under R version 4.2.2
Warning: package 'readr' was built under R version 4.2.2
Warning: package 'purrr' was built under R version 4.2.2
Warning: package 'broom' was built under R version 4.2.2
Warning: package 'dials' was built under R version 4.2.2
Warning: package 'parsnip' was built under R version 4.2.2
Warning: package 'recipes' was built under R version 4.2.2
Warning: package 'leaflet' was built under R version 4.2.2
Warning: package 'kableExtra' was built under R version 4.2.3
Introduction and Data
Motivation and Context
The motivation for this project stemmed from the measles dataset from tidytuesday. It was interesting to see how the data set categorically characterized the data. Our team imported the data into R and used the categories as a guide to make our plots and questions. The data as reported in the Wall Street Journal presents a map of measles, mumps, and rubella (MMR) vaccination rates in schools across the United States, showing that some schools have dangerously low MMR vaccination rates, which increases the risk of measles outbreaks. The data is based on information from the 2018-2019 school year and includes public, private, and charter schools. According to the map, many of the schools with the lowest vaccination rates are in states such as Idaho, Utah, Colorado, and Oregon. The article also notes that measles cases have been on the rise in recent years, and emphasizes the importance of vaccination in preventing the spread of the highly contagious virus. Through this narrative and viewing the raw data we were able to form our hypothesis and question.
Research question: Are schools’ vaccination rates influence by the type of school, state it’s located in, and it’s enrollment numbers? If so, can valid predictions on vaccination rates be made from these variables?
Hypothesis: It is expected that private schools with higher enrollment numbers will have higher rates of MMR vaccination. It is also expected that states with a high concentration of these schools will have higher vaccination rates.
The Data:
Quantitative - vaccination rates
Categorical - private or public and county and state levels
Literature Review
The article from the Wall Street Journal presents a map of measles vaccination rates in schools across the United States, showing that some schools have dangerously low vaccination rates, which increases the risk of measles outbreaks. The data is based on information from the 2018-2019 school year and includes public, private, and charter schools. According to the map, many of the schools with the lowest vaccination rates are in states such as Idaho, Utah, Colorado, and Oregon. The article also notes that measles cases have been on the rise in recent years, and emphasizes the importance of vaccination in preventing the spread of the highly contagious virus. Our research is directly related to the topic of the article because the article talks about the data included in the csv. Additionally, we aim to fit a model to predict MMR vaccination rates based on the variables being tested: public v. private status, enrollment statistics, and type of geographical region status (urban vs rural).
Methodology
visualizations and summary statistics
Rows: 66113 Columns: 16
── Column specification ────────────────────────────────────────────────────────
Delimiter: ","
chr (6): state, year, name, type, city, county
dbl (8): index, enroll, mmr, overall, xmed, xper, lat, lng
lgl (2): district, xrel
ℹ Use `spec()` to retrieve the full column specification for this data.
ℹ Specify the column types or set `show_col_types = FALSE` to quiet this message.
Rows: 66,113
Columns: 16
$ index <dbl> 1, 2, 3, 4, 5, 6, 7, 8, 9, 10, 10, 11, 12, 13, 14, 15, 15, 16…
$ state <chr> "Arizona", "Arizona", "Arizona", "Arizona", "Arizona", "Arizo…
$ year <chr> "2018-19", "2018-19", "2018-19", "2018-19", "2018-19", "2018-…
$ name <chr> "A J Mitchell Elementary", "Academy Del Sol", "Academy Del So…
$ type <chr> "Public", "Charter", "Charter", "Charter", "Charter", "Public…
$ city <chr> "Nogales", "Tucson", "Tucson", "Phoenix", "Phoenix", "Phoenix…
$ county <chr> "Santa Cruz", "Pima", "Pima", "Maricopa", "Maricopa", "Marico…
$ district <lgl> NA, NA, NA, NA, NA, NA, NA, NA, NA, NA, NA, NA, NA, NA, NA, N…
$ enroll <dbl> 51, 22, 85, 60, 43, 36, 24, 22, 26, 78, 78, 35, 54, 54, 34, 5…
$ mmr <dbl> 100, 100, 100, 100, 100, 100, 100, 100, 100, 100, 100, 100, 1…
$ overall <dbl> -1, -1, -1, -1, -1, -1, -1, -1, -1, -1, -1, -1, -1, -1, -1, -…
$ xrel <lgl> NA, NA, NA, NA, NA, NA, NA, NA, NA, NA, NA, NA, NA, NA, NA, N…
$ xmed <dbl> NA, NA, NA, NA, 2.33, NA, NA, NA, NA, NA, NA, 2.86, NA, 7.41,…
$ xper <dbl> NA, NA, NA, NA, 2.33, NA, 4.17, NA, NA, NA, NA, NA, NA, NA, N…
$ lat <dbl> 31.34782, 32.22192, 32.13049, 33.48545, 33.49562, 33.43532, 3…
$ lng <dbl> -110.9380, -110.8961, -111.1170, -112.1306, -112.2247, -112.1…
`summarise()` has grouped output by 'name', 'city', 'state', 'lat', 'lng'. You
can override using the `.groups` argument.
Assuming "lng" and "lat" are longitude and latitude, respectively
Figure 1. Each data point represents a school, and the color represents the mmr vaccination rate at that school (reported) - where a dark blue would represent low vaccination rates (if any) and dark red would represent almost 100% (if not 100%) vaccination rates. This visualization will be used to 1) understand variability of vaccination rates in schools across different states, and 2) help us create valid connections between states that have substantially different mmr vaccination rates.
Full Disclaimer: Points in Asia were removed, because this study focuses only on data from the US. It is uknown why those coordinates were in the data in the first place.
Warning in state == c("Illinois", "Massachusetts", "Pennsylvania", "Arkansas", :
longer object length is not a multiple of shorter object length
Warning in state == c("Illinois", "Massachusetts", "Pennsylvania", "Arkansas", :
longer object length is not a multiple of shorter object length
Warning in state == c("Illinois", "Massachusetts", "Pennsylvania", "Arkansas", :
longer object length is not a multiple of shorter object length
Warning in state == c("Illinois", "Massachusetts", "Pennsylvania", "Arkansas", :
longer object length is not a multiple of shorter object length
Warning in state == c("Illinois", "Massachusetts", "Pennsylvania", "Arkansas", :
longer object length is not a multiple of shorter object length
Warning in state == c("Illinois", "Massachusetts", "Pennsylvania", "Arkansas", :
longer object length is not a multiple of shorter object length
Warning in state == c("Illinois", "Massachusetts", "Pennsylvania", "Arkansas", :
longer object length is not a multiple of shorter object length
Warning in state == c("Illinois", "Massachusetts", "Pennsylvania", "Arkansas", :
longer object length is not a multiple of shorter object length
Warning in state == c("Illinois", "Massachusetts", "Pennsylvania", "Arkansas", :
longer object length is not a multiple of shorter object length
Warning in state == c("Illinois", "Massachusetts", "Pennsylvania", "Arkansas", :
longer object length is not a multiple of shorter object length
Warning in state == c("Illinois", "Massachusetts", "Pennsylvania", "Arkansas", :
longer object length is not a multiple of shorter object length
Warning in state == c("Illinois", "Massachusetts", "Pennsylvania", "Arkansas", :
longer object length is not a multiple of shorter object length
Warning in state == c("Illinois", "Massachusetts", "Pennsylvania", "Arkansas", :
longer object length is not a multiple of shorter object length
Warning in state == c("Illinois", "Massachusetts", "Pennsylvania", "Arkansas", :
longer object length is not a multiple of shorter object length
Warning in state == c("Illinois", "Massachusetts", "Pennsylvania", "Arkansas", :
longer object length is not a multiple of shorter object length
Warning in state == c("Illinois", "Massachusetts", "Pennsylvania", "Arkansas", :
longer object length is not a multiple of shorter object length
Warning in state == c("Illinois", "Massachusetts", "Pennsylvania", "Arkansas", :
longer object length is not a multiple of shorter object length
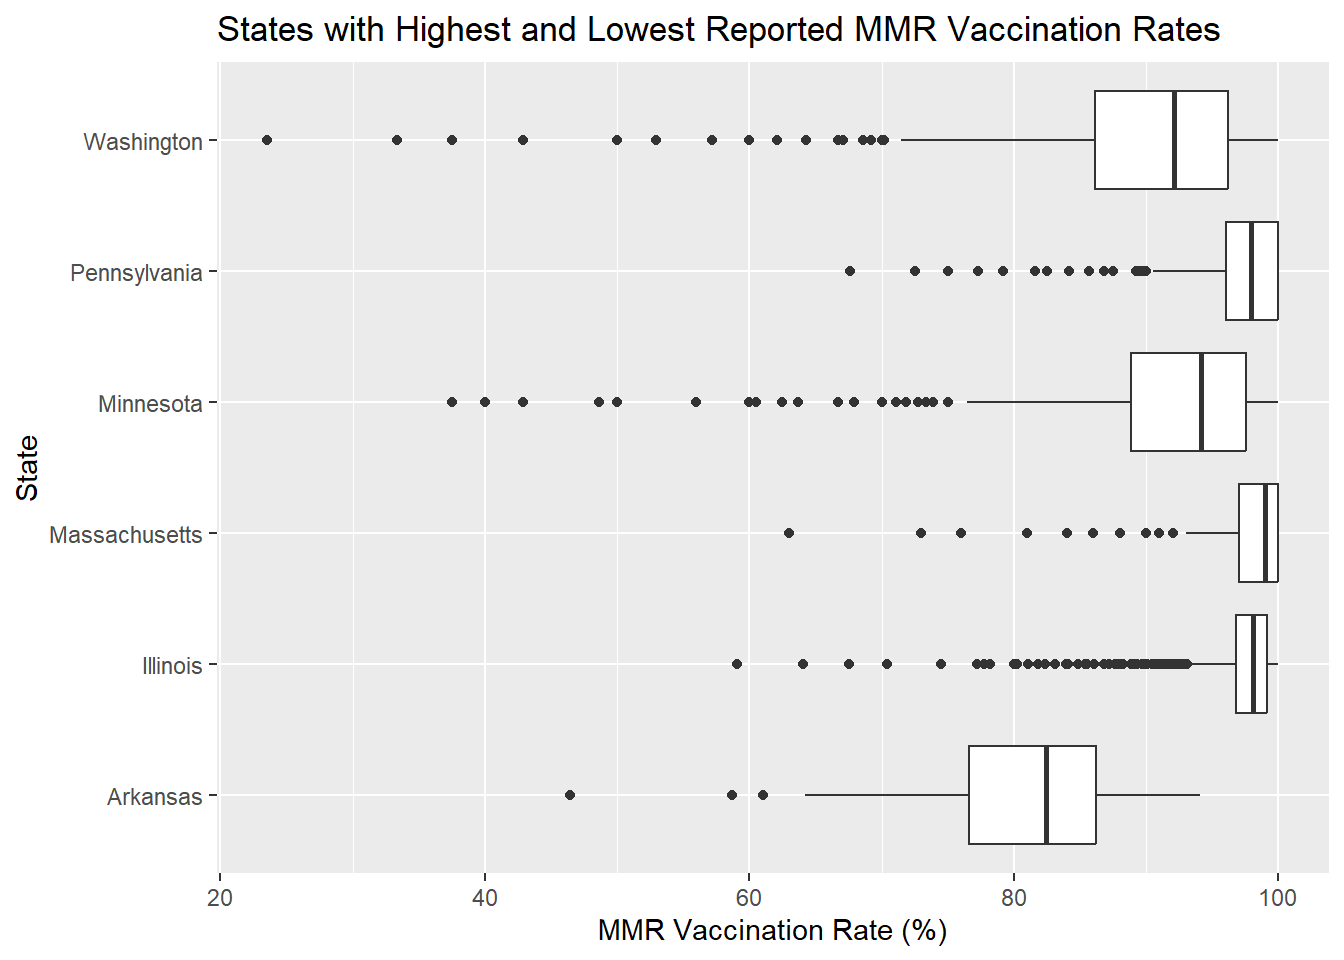
Figure 2. This plot represents the six states with the highest and lowest MMR vaccination rates from the total states sampled. The states with the lowest reported MMR vaccination rates is Arkansas, Washington, and Minnesota. The states with the highest reported MMR vaccination rates is Massachusetts, Illinois, and Pennsylvania.
# A tibble: 21 × 3
state max min
<chr> <dbl> <dbl>
1 Arizona 100 15.4
2 Arkansas 96.1 17.2
3 California 99 1
4 Colorado 100 16.2
5 Connecticut 100 67.9
6 Illinois 100 10.4
7 Maine 100 38.5
8 Massachusetts 100 3
9 Minnesota 100 20
10 Missouri 99 1
# … with 11 more rows
`summarise()` has grouped output by 'state'. You can override using the
`.groups` argument.
`summarise()` has grouped output by 'county', 'state'. You can override using
the `.groups` argument.
`summarise()` has grouped output by 'county', 'state'. You can override using
the `.groups` argument.
# A tibble: 682 × 3
# Groups: county, state [662]
county state mmr
<chr> <chr> <dbl>
1 Los Angeles California 1
2 San Bernardino California 1
3 <NA> Missouri 1
4 Montgomery Ohio 2.78
5 Berkshire Massachusetts 3
6 Seneca New York 3.2
7 Flathead Montana 9.43
8 Snohomish Washington 10
9 Cook Illinois 10.4
10 Mohave Arizona 15.4
# … with 672 more rows
Figure 3. This graph shows the highest and lowest mmr counties by state. Several states have multiple counties with 100% mmr vaccination rate, but few to none have matching lowest mmrs between counties. If data was not available on the mmr rate of a school, it was removed.
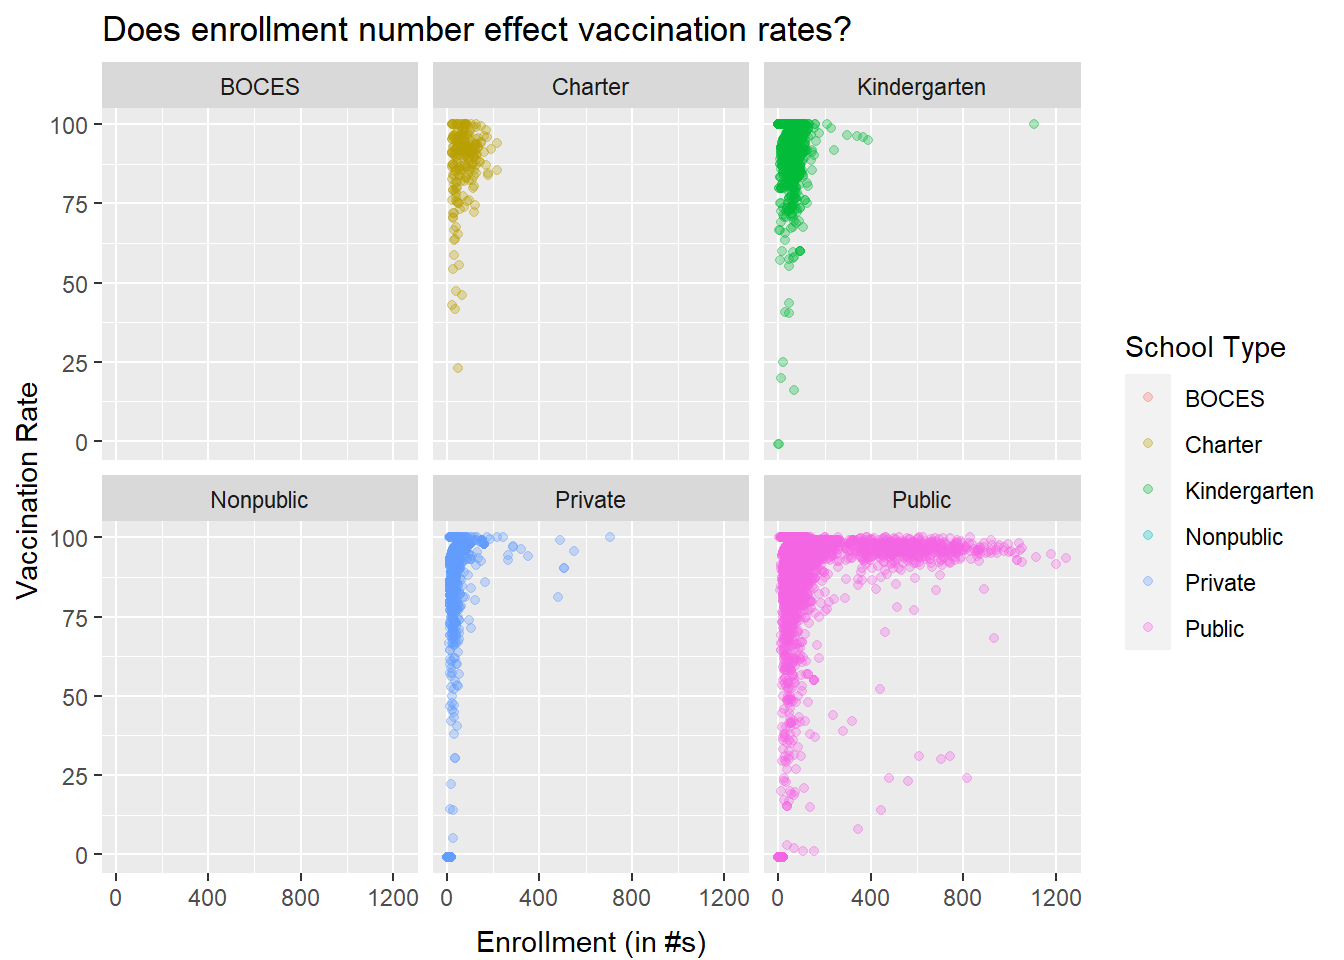
Warning: Removed 7411 rows containing missing values (`geom_point()`).
Figure 4. No data was reported for BOCES, and non public schools. This visualization refutes the idea that enrollment numbers influences reported MMR vaccination rates, though it may show that high enrollment numbers for public schools and for other school types (not including BOCES, and non public schools) suggests a higher MMR vaccination rate reported.
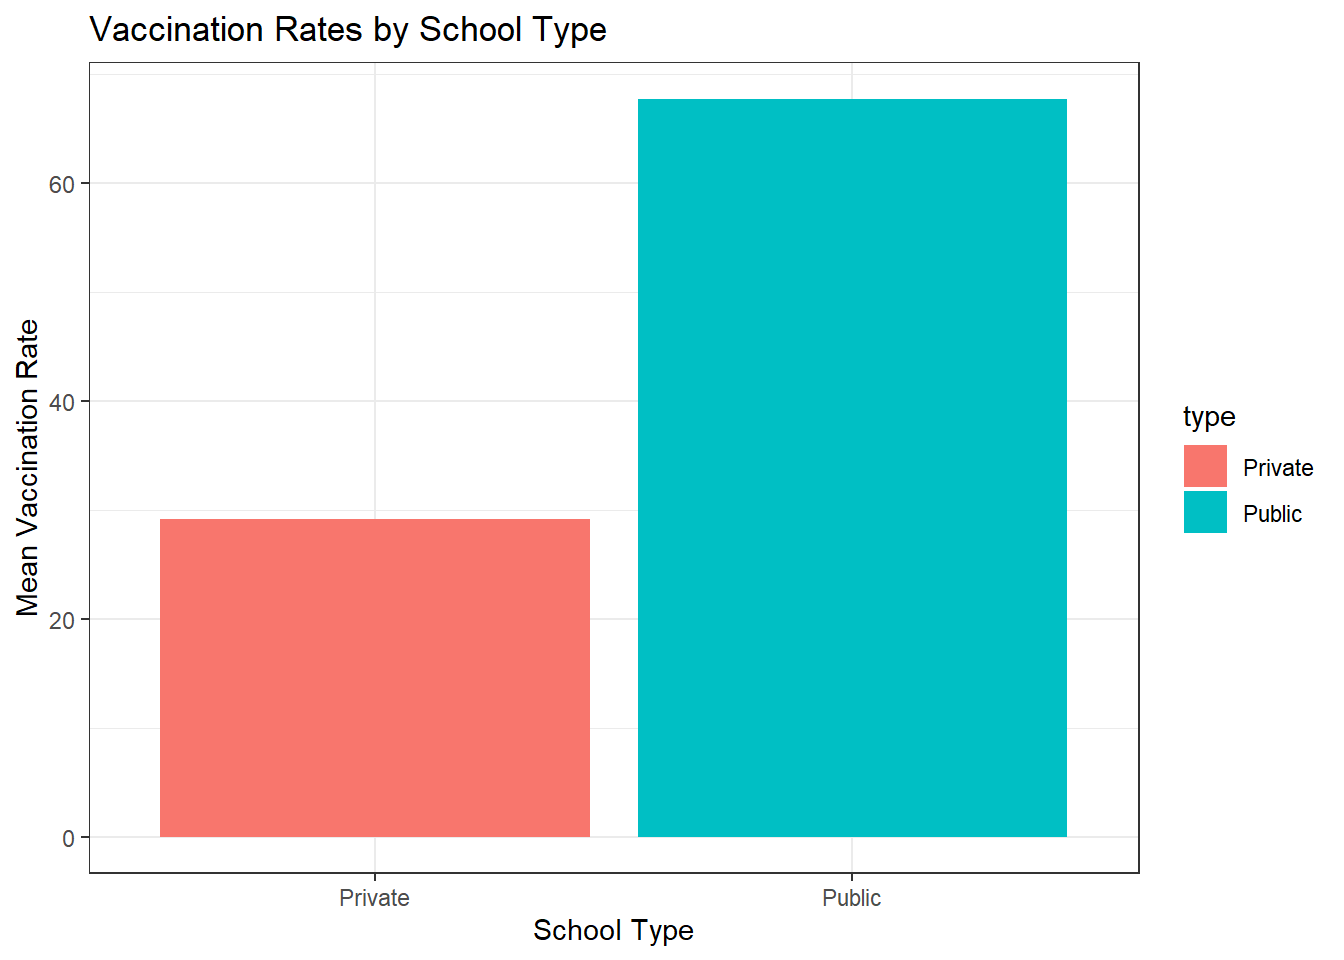
Figure 5.
State highest vs. lowest (county x, county y)
\(H_0: \bar x_{public}-\bar x_{private}=0\) difference in mean vaccination rate is 0, there is no significant difference
\(H_A: \bar x_{public}-\bar x_{private}\ne0\) difference in mean vaccination rate is not 0, there is a significant difference
# A tibble: 2 × 2
type m
<chr> <dbl>
1 Private 62.4
2 Public 91.8
Warning: Please be cautious in reporting a p-value of 0. This result is an
approximation based on the number of `reps` chosen in the `generate()` step. See
`?get_p_value()` for more information.
# A tibble: 1 × 1
p_value
<dbl>
1 0
We find evidence to reject the null hypothesis (p < .05) and we find strong evidence for the alternative hypothesis that the vaccination rate in public schools is significantly higher than in private schools.
Models & Prediction
In order to fit the scope of our hypothesis we chose to include the following variables for our models: type, enroll, and state.
| term |
estimate |
std.error |
statistic |
p.value |
| (Intercept) |
83.5755081 |
2.6393600 |
31.6650653 |
0.0000000 |
| typeKindergarten |
4.0497044 |
7.0295542 |
0.5760969 |
0.5645556 |
| typePrivate |
4.4187705 |
4.8400286 |
0.9129637 |
0.3612716 |
| typePublic |
8.8688080 |
3.2505490 |
2.7284031 |
0.0063692 |
| enroll |
0.0596794 |
0.0313213 |
1.9053931 |
0.0567420 |
| stateCalifornia |
-14.0644653 |
1.9348712 |
-7.2689412 |
0.0000000 |
| stateColorado |
7.0629988 |
6.4687726 |
1.0918607 |
0.2749063 |
| stateOhio |
-3.9569538 |
2.0626690 |
-1.9183658 |
0.0550776 |
| stateUtah |
1.2760663 |
2.7093736 |
0.4709821 |
0.6376582 |
| typeKindergarten:enroll |
-0.0425918 |
0.0942434 |
-0.4519337 |
0.6513212 |
| typePrivate:enroll |
-0.0307656 |
0.0909268 |
-0.3383558 |
0.7350983 |
| typePublic:enroll |
-0.0380893 |
0.0392166 |
-0.9712534 |
0.3314328 |
| typeKindergarten:stateCalifornia |
NA |
NA |
NA |
NA |
| typePrivate:stateCalifornia |
-57.7253609 |
4.5301548 |
-12.7424697 |
0.0000000 |
| typePublic:stateCalifornia |
NA |
NA |
NA |
NA |
| typeKindergarten:stateColorado |
NA |
NA |
NA |
NA |
| typePrivate:stateColorado |
NA |
NA |
NA |
NA |
| typePublic:stateColorado |
NA |
NA |
NA |
NA |
| typeKindergarten:stateOhio |
NA |
NA |
NA |
NA |
| typePrivate:stateOhio |
6.1547397 |
4.6702823 |
1.3178517 |
0.1875670 |
| typePublic:stateOhio |
NA |
NA |
NA |
NA |
| typeKindergarten:stateUtah |
NA |
NA |
NA |
NA |
| typePrivate:stateUtah |
1.0105953 |
6.9539291 |
0.1453272 |
0.8844538 |
| typePublic:stateUtah |
NA |
NA |
NA |
NA |
| enroll:stateCalifornia |
0.1440564 |
0.0239135 |
6.0240637 |
0.0000000 |
| enroll:stateColorado |
-0.0284074 |
0.0881911 |
-0.3221122 |
0.7473708 |
| enroll:stateOhio |
0.0154724 |
0.0254120 |
0.6088610 |
0.5426229 |
| enroll:stateUtah |
-0.0183839 |
0.0238506 |
-0.7707944 |
0.4408371 |
| typeKindergarten:enroll:stateCalifornia |
NA |
NA |
NA |
NA |
| typePrivate:enroll:stateCalifornia |
1.0331692 |
0.0898724 |
11.4959624 |
0.0000000 |
| typePublic:enroll:stateCalifornia |
NA |
NA |
NA |
NA |
| typeKindergarten:enroll:stateColorado |
NA |
NA |
NA |
NA |
| typePrivate:enroll:stateColorado |
NA |
NA |
NA |
NA |
| typePublic:enroll:stateColorado |
NA |
NA |
NA |
NA |
| typeKindergarten:enroll:stateOhio |
NA |
NA |
NA |
NA |
| typePrivate:enroll:stateOhio |
0.0148218 |
0.0933866 |
0.1587143 |
0.8738954 |
| typePublic:enroll:stateOhio |
NA |
NA |
NA |
NA |
| typeKindergarten:enroll:stateUtah |
NA |
NA |
NA |
NA |
| typePrivate:enroll:stateUtah |
0.0048797 |
0.0921312 |
0.0529648 |
0.9577604 |
| typePublic:enroll:stateUtah |
NA |
NA |
NA |
NA |
The interactive model has an adjusted r-squared of 0.4717082.
| term |
estimate |
std.error |
statistic |
p.value |
| (Intercept) |
81.1839489 |
1.5657184 |
51.850927 |
0.0000000 |
| typeKindergarten |
-13.0939027 |
5.3394305 |
-2.452303 |
0.0142022 |
| typePrivate |
-18.8499552 |
1.7724264 |
-10.635113 |
0.0000000 |
| typePublic |
7.8614600 |
1.7206765 |
4.568819 |
0.0000049 |
| enroll |
0.0922677 |
0.0027396 |
33.679627 |
0.0000000 |
| stateCalifornia |
-5.8650145 |
0.7639301 |
-7.677423 |
0.0000000 |
| stateColorado |
21.0127953 |
5.0706937 |
4.143969 |
0.0000343 |
| stateOhio |
4.4453417 |
0.8578398 |
5.182018 |
0.0000002 |
| stateUtah |
-37.5748208 |
1.6469356 |
-22.814992 |
0.0000000 |
The additive model has an adjusted r-squared of 0.2430603.
The higher adjusted r squared for the interactive model, over the additive one, suggests that the interactive model has a better overall fit. We will use the interactive model as a baseline to test the prediction strength of type and state as well as enroll and state.
| term |
estimate |
std.error |
statistic |
p.value |
| (Intercept) |
86.9521985 |
3.8643422 |
22.5011643 |
0.0000000 |
| typeCharter |
-18.0127782 |
4.1595070 |
-4.3305079 |
0.0000149 |
| typeKindergarten |
-59.2164703 |
7.0297642 |
-8.4236781 |
0.0000000 |
| typeNonpublic |
-79.8734621 |
4.3675080 |
-18.2881088 |
0.0000000 |
| typePrivate |
-58.1724217 |
4.2250794 |
-13.7683616 |
0.0000000 |
| typePublic |
0.0265396 |
3.7743600 |
0.0070316 |
0.9943897 |
| stateCalifornia |
5.8082822 |
0.8580983 |
6.7687840 |
0.0000000 |
| stateColorado |
66.3421280 |
5.8348223 |
11.3700340 |
0.0000000 |
| stateConnecticut |
1.8451364 |
1.3184303 |
1.3994949 |
0.1616752 |
| stateMassachusetts |
-8.1917346 |
1.1301765 |
-7.2481903 |
0.0000000 |
| stateNew York |
11.8009930 |
1.0125877 |
11.6542917 |
0.0000000 |
| stateOhio |
1.1039465 |
0.9954669 |
1.1089735 |
0.2674507 |
| stateUtah |
8.2070762 |
1.3535592 |
6.0633299 |
0.0000000 |
| typeCharter:stateCalifornia |
NA |
NA |
NA |
NA |
| typeKindergarten:stateCalifornia |
NA |
NA |
NA |
NA |
| typeNonpublic:stateCalifornia |
NA |
NA |
NA |
NA |
| typePrivate:stateCalifornia |
11.9448529 |
1.9742284 |
6.0503905 |
0.0000000 |
| typePublic:stateCalifornia |
NA |
NA |
NA |
NA |
| typeCharter:stateColorado |
NA |
NA |
NA |
NA |
| typeKindergarten:stateColorado |
NA |
NA |
NA |
NA |
| typeNonpublic:stateColorado |
NA |
NA |
NA |
NA |
| typePrivate:stateColorado |
NA |
NA |
NA |
NA |
| typePublic:stateColorado |
NA |
NA |
NA |
NA |
| typeCharter:stateConnecticut |
NA |
NA |
NA |
NA |
| typeKindergarten:stateConnecticut |
NA |
NA |
NA |
NA |
| typeNonpublic:stateConnecticut |
NA |
NA |
NA |
NA |
| typePrivate:stateConnecticut |
NA |
NA |
NA |
NA |
| typePublic:stateConnecticut |
NA |
NA |
NA |
NA |
| typeCharter:stateMassachusetts |
NA |
NA |
NA |
NA |
| typeKindergarten:stateMassachusetts |
NA |
NA |
NA |
NA |
| typeNonpublic:stateMassachusetts |
NA |
NA |
NA |
NA |
| typePrivate:stateMassachusetts |
-11.0448323 |
2.3538157 |
-4.6923097 |
0.0000027 |
| typePublic:stateMassachusetts |
NA |
NA |
NA |
NA |
| typeCharter:stateNew York |
NA |
NA |
NA |
NA |
| typeKindergarten:stateNew York |
NA |
NA |
NA |
NA |
| typeNonpublic:stateNew York |
NA |
NA |
NA |
NA |
| typePrivate:stateNew York |
48.2612529 |
2.0563162 |
23.4697631 |
0.0000000 |
| typePublic:stateNew York |
NA |
NA |
NA |
NA |
| typeCharter:stateOhio |
NA |
NA |
NA |
NA |
| typeKindergarten:stateOhio |
NA |
NA |
NA |
NA |
| typeNonpublic:stateOhio |
NA |
NA |
NA |
NA |
| typePrivate:stateOhio |
46.1414052 |
2.1342507 |
21.6194867 |
0.0000000 |
| typePublic:stateOhio |
NA |
NA |
NA |
NA |
| typeCharter:stateUtah |
NA |
NA |
NA |
NA |
| typeKindergarten:stateUtah |
NA |
NA |
NA |
NA |
| typeNonpublic:stateUtah |
NA |
NA |
NA |
NA |
| typePrivate:stateUtah |
55.5443591 |
4.9556399 |
11.2083123 |
0.0000000 |
| typePublic:stateUtah |
NA |
NA |
NA |
NA |
| term |
estimate |
std.error |
statistic |
p.value |
| (Intercept) |
89.5438570 |
1.1544104 |
77.5667482 |
0.0000000 |
| enroll |
0.0423208 |
0.0145255 |
2.9135464 |
0.0035751 |
| stateArkansas |
-7.6186390 |
2.1789129 |
-3.4965321 |
0.0004718 |
| stateCalifornia |
-30.1605807 |
1.1804534 |
-25.5499969 |
0.0000000 |
| stateColorado |
5.0028329 |
1.2999912 |
3.8483590 |
0.0001191 |
| stateFlorida |
-90.5438570 |
1.3692136 |
-66.1283651 |
0.0000000 |
| stateIllinois |
7.0682630 |
1.2042257 |
5.8695498 |
0.0000000 |
| stateIowa |
-90.5438570 |
1.4044800 |
-64.4678864 |
0.0000000 |
| stateMaine |
2.6125077 |
1.4469990 |
1.8054661 |
0.0710080 |
| stateMichigan |
-90.5438570 |
1.2993181 |
-69.6856736 |
0.0000000 |
| stateMinnesota |
-2.4557221 |
1.3205797 |
-1.8595789 |
0.0629512 |
| stateMontana |
6.4715249 |
1.4384919 |
4.4988260 |
0.0000068 |
| stateNew Jersey |
-90.5438570 |
1.2828797 |
-70.5786020 |
0.0000000 |
| stateNorth Carolina |
-90.5438570 |
1.3229762 |
-68.4395224 |
0.0000000 |
| stateNorth Dakota |
1.7958954 |
1.8362555 |
0.9780205 |
0.3280691 |
| stateOhio |
0.1672697 |
1.2546708 |
0.1333176 |
0.8939428 |
| stateOregon |
-3.4410777 |
1.5895466 |
-2.1648171 |
0.0304066 |
| statePennsylvania |
6.8126466 |
1.3260408 |
5.1375843 |
0.0000003 |
| stateRhode Island |
-90.5438570 |
2.2835395 |
-39.6506632 |
0.0000000 |
| stateSouth Dakota |
0.7915256 |
1.5966733 |
0.4957342 |
0.6200842 |
| stateTennessee |
-90.5438570 |
1.5208128 |
-59.5364902 |
0.0000000 |
| stateUtah |
3.7272339 |
1.8471963 |
2.0177790 |
0.0436198 |
| stateVermont |
-2.3743595 |
1.6433668 |
-1.4448141 |
0.1485166 |
| enroll:stateArkansas |
-0.0450703 |
0.0148989 |
-3.0250757 |
0.0024870 |
| enroll:stateCalifornia |
0.2984087 |
0.0147744 |
20.1977274 |
0.0000000 |
| enroll:stateColorado |
-0.0505891 |
0.0165938 |
-3.0486774 |
0.0022998 |
| enroll:stateFlorida |
-0.0423208 |
0.0163123 |
-2.5944179 |
0.0094780 |
| enroll:stateIllinois |
-0.0400754 |
0.0145499 |
-2.7543424 |
0.0058832 |
| enroll:stateIowa |
-0.0423208 |
0.0147168 |
-2.8756723 |
0.0040334 |
| enroll:stateMaine |
-0.0402012 |
0.0149972 |
-2.6805868 |
0.0073518 |
| enroll:stateMichigan |
-0.0423208 |
0.0167496 |
-2.5266789 |
0.0115178 |
| enroll:stateMinnesota |
0.0233447 |
0.0169198 |
1.3797286 |
0.1676766 |
| enroll:stateMontana |
-0.0497164 |
0.0146853 |
-3.3854616 |
0.0007112 |
| enroll:stateNew Jersey |
-0.0423208 |
0.0167638 |
-2.5245291 |
0.0115885 |
| enroll:stateNorth Carolina |
-0.0423208 |
0.0168044 |
-2.5184415 |
0.0117907 |
| enroll:stateNorth Dakota |
-0.0063723 |
0.0315009 |
-0.2022904 |
0.8396905 |
| enroll:stateOhio |
-0.0143150 |
0.0159291 |
-0.8986746 |
0.3688305 |
| enroll:stateOregon |
0.0749675 |
0.0220176 |
3.4048907 |
0.0006624 |
| enroll:statePennsylvania |
-0.0347961 |
0.0164128 |
-2.1200549 |
0.0340065 |
| enroll:stateRhode Island |
-0.0423208 |
0.0356664 |
-1.1865719 |
0.2354024 |
| enroll:stateSouth Dakota |
0.0464033 |
0.0268801 |
1.7263097 |
0.0842981 |
| enroll:stateTennessee |
-0.0423208 |
0.0186132 |
-2.2737032 |
0.0229882 |
| enroll:stateUtah |
-0.0383824 |
0.0147634 |
-2.5998297 |
0.0093298 |
| enroll:stateVermont |
-0.0143949 |
0.0154172 |
-0.9336891 |
0.3504690 |
Warning in predict.lm(object = object$fit, newdata = new_data, type =
"response"): prediction from a rank-deficient fit may be misleading
# A tibble: 1 × 1
.pred
<dbl>
1 94.6
Using the interactive model, we were able to predict a 94.6% MMR vaccination rate for 100 students enrolled in a public school in Arizona. This model could also be applied to other contexts with simple numerical changes.
Results
Figure 1 - This visualization answers the 1st research question by showing which states have a high percentage of mmr vaccination rates across different schools (such as Ohio), and states that have a low percentage (such as Florida). Though Ohio and Florida don’t show much variability across different schools, California does show a lot of variability. Overall, this shows a general map of how mmr vaccination rates differ across different regions in the US.
Figure 2 - To explore if there is a relationship between urban and rural status and MMR vaccination rate, first, the states with the highest (Massachusetts, Illinois, and Pennsylvania) and lowest (Arkansas, Washington, and Minnesota) mean MMR vaccination rates were plotted. On its own this does not display any relation of urban or rural status to percentage of MMR vaccination rates, so information, provided by Iowa State University, on the 2010 U.S. Decennial Cenus was referenced \(^1\). The percentage of the total population in urban areas per each state was found: Massachusetts (92%), Illinois (88.5%), Pennsylvania (78.7%), Arkansas (56.2%), Washington (84.1%), and Minnesota (73.3%). There appears to be a weak correlation between urban/rural status of each state and MMR vaccination rate, but to a slight degree there is a trend. For instance, the state with the most drastic difference in mean MMR vaccination rate is Arkansas (80.49%) when compared to states with the highest mean MMR vaccination rates (>95%). Relatedly, Arkansas also has a significantly lower percentage of the total population in urban areas. States like Massachusetts and Illinois hold comparably higher percentages of the total population in urban areas and hold the highest mean MMR vaccination rates, 97.04% & 97.39%, respectively. However, states like Washington weaken the correlation by having a high percentage of the total population in urban areas, but reporting a comparably low mean MMR vaccination rate (89.3%).
Figure 3 - The data reported for maximum and minimum average vaccination rate by county in each state showed that most states had a maximum vaccination rate of 99 or 100%. On the other hand, minimum vaccination rates ranged from 1% to 96%. States often had several counties tied at the maximum. One noteworthy finding is that California had several counties all at 99, which is odd. It’s very likely that some of the data was influenced by the removal of NA values, and there was also one minimum school missing its County in Missouri.
Figure 4 - The data reported for Charter, Kindergarten and Private schools shows that for schools with no new enrollments the vaccination rates reported differ significantly. For public schools we see a little more diversity, but no strong correlation either. Public schools with 0 new enrollments may have high or even no vaccination rates reported, but generally we see that a high enrollment rate rarely leads to low vaccination rates (this also applies to Charter, Kindergarten, and private schools). This visualization answers the question on whether or not enrollment numbers has an effect on vaccination rates, for which it was determined, enrollment rate is not a determining factor.
Figure 5 - The graph showing the average vaccination rates between private and public schools seems to show a higher average vaccination rate for public schools. This is possibly due to local government rules and control over public schools in which students may be mandated to get vaccinated. Whereas in private schools it may have been more up to choice and out of government control. The resulting hypothesis test showed that there is a significant difference in vaccination rate between public schools and private school (p<.05). This number may not be wholly accurate due to the removal of much private school data, but we assume the difference can be attributed to a lack of vaccine mandate within private schools.
The additive model yielded an adjusted r-square value of 0.243 using the type, enroll, and state variables. This was a considerably lower adjusted r-squared value than the interactive model which yielded an adjusted-r-squared of 0.47. Therefore, we continued using the interactive model as a framework for testing the predictability of other variables. We proceeded to test the predictability of enrollment and and type through constructing two separate models with one being state and enroll and the other being state and type. We found that the model with state and enroll had a far higher adjusted-r-squared of 0.87 compared to the other model’s adjusted r-squared of 0.34. Despite the higher adjusted r squared, our question evaluated whether state, enrollment number, and type of school would be good predictors, so we chose the original interactive model for the prediction. We were not really quite sure why this occurred however it was an interesting finding that warrants further investigation in future studies.
Discussion
Summary: From our analyses, we learned that whether students attend a private or public school DOES affect, at least to some extent, how high vaccination rates are. In addition, and in answer to our research questions, state, type of school, and enrollment number provide good predictions on the vaccination rates reported - with enrollment and state being the best predictors. In essence, all our factors influence schools’ vaccination rates.
Ethical considerations: Vaccination data is listed under the Health Insurance Portability and Accountability Act (HIPAA) as protected health information and therefore cannot be shared without patient consent. In certain areas, vaccine data is not required for schools as well. The data may also be used to discriminate against certain areas unjustly. The US does not all benefit equally from our research. Some areas may so be more or less receptive to revealing their vaccination information so the study may not impact our target population equally.
Limitations: We saw negative values in the dataset, but we don’t know exactly what it means - we speculate that perhaps these suggest that the schools did/do not report vaccination rates.
Some states do not require schools to report MMR vaccination data, thus resulting in a lack of information for a few states. This results in inconclusive data from those states, and they will not be considered for this research analysis.
While our research question seeks to understand the influence of geographic region status (urban vs rural), the dataset collected does not contain information on the geographic status where each school is located. While we pooled external information drawn from the 2010 US Decennial Census, the analysis derived might not accurately reflect the relationship between these two variables.
Future work: Our study had a very defined scope. However, future work could include observing vaccination rates in different states or outside of the US. Additionally, testing other variables in anticipation of yielding a stronger predictive model could be another route. Last but not least, this data relies mostly on reported vaccination rates from 2018-19, so other (perhaps more current) years should be considered to reach thorough conclusions. Perhaps comparing this data with measles outbreak or cases, would be an interesting route to understand the effect that vaccination rates in schools have on measles cases.
##References
Moriarty, D., Umlauf, T., & Abbott, B. (2019). U.S. Measles Vaccination Data [Data set]. https://github.com/WSJ/measles-data
Moriarty, D., Umlauf, T., & Abbott, B. (2019). What’s the measles vaccination rate at your child’s school? The Wall Street Journal. https://www.wsj.com/graphics/school-measles-rate-map/
“Urban Percentage of the Population for States, Historical.” Iowa State University | Iowa Community Indicators Program, Iowa State University, www.icip.iastate.edu/tables/population/urban-pct-states.