Hypothesis Testing II
Lecture 22
Dr. Elijah Meyer
Duke University
STA 199 - Spring 2023
April 5th, 2023
Checklist
– Clone ae-21
– Lab 9 Due Tuesday (April 11th)
– HW-6 (Statistics Experience) due April 28th
– Project Draft Report due Friday (April 7th)
– HW 5 Released Today
– Good Conversation in Slack! Check it out
– Second Peer Evaluation (April 10th)
Research Participation
– Research team creating an intro data science assessment
– We would like to have students in an intro data science course take the assessment
– Pin down how students think about things so that we can better phrase our questions
– Located at the end of HW 5
– Your responses matter!
Project Announcement
– Include literature review in report
In Lab
– Hypothesis Testing With 1 categorical explanatory variable + 1 quantitative response
– \(\alpha\)
– Bonferroni Correction
Goals for Today
– “Training our brains” to ask critical questions
– Hypothesis Testing With 1 categorical explanatory variable + 1 quantitative response
— How do we create the null distribution using permutation techniques?
— Write interpretations; decisions; conclusions in the context of the problem
– Theory based techniques
Warm Up
– What is a Bonferroni Correction?
– Why do we care about it?
Slim by Chocolate!

A team of German researchers had found that people on a low-carb diet lost weight 10 percent faster if they ate a chocolate bar every day.
We ran an actual clinical trial, with subjects randomly assigned to different diet regimes. And the statistically significant benefits of chocolate that we reported are based on the actual data. It was, in fact, a fairly typical study for the field of diet research.
The Study
5 men and 11 women showed up, aged 19 to 67. . . . After a round of questionnaires and blood tests to ensure that no one had eating disorders, diabetes, or other illnesses that might endanger them, Frank randomly assigned the subjects to one of three diet groups. One group followed a low-carbohydrate diet. Another followed the same low-carb diet plus a daily 1.5 oz. bar of dark chocolate. And the rest, a control group, were instructed to make no changes to their current diet. They weighed themselves each morning for 21 days, and the study finished with a final round of questionnaires and blood tests.
The Hoax
“One beer-fueled weekend later and… jackpot! Both of the treatment groups lost about 5 pounds over the course of the study, while the control group’s average body weight fluctuated up and down around zero. But the people on the low-carb diet plus chocolate? They lost weight 10 percent faster. Not only was that difference statistically significant, but the chocolate group had better cholesterol readings and higher scores on the well-being survey.”
The Hoax
If you measure a large number of things about a small number of people, you are almost guaranteed to get a “statistically significant” result. Our study included 18 different measurements—weight, cholesterol, sodium, blood protein levels, sleep quality, well-being, etc…. from 15 people. . . .
With our 18 measurements, we had a 60% chance of getting some “significant” result with p < 0.05.
I Fooled Millions Into Thinking Chocolate Helps Weight Loss. Here’s How
It was, in fact, a fairly typical study for the field of diet research. Which is to say: It was terrible science. The results are meaningless, and the health claims that the media blasted out to millions of people around the world are utterly unfounded.
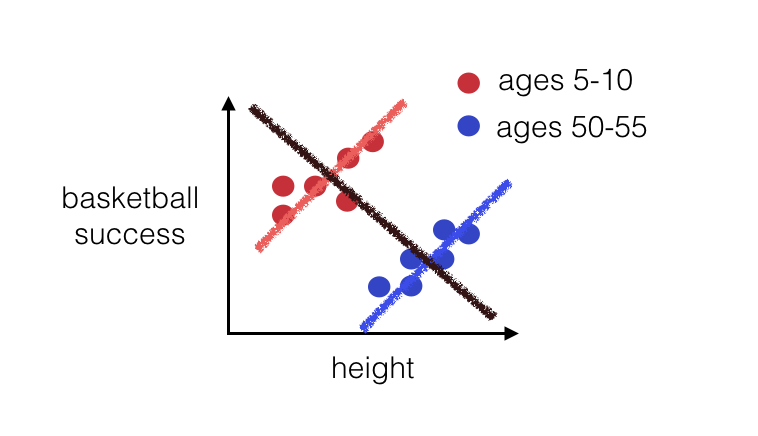
Simpson’s Paradox

In Summary
We as researchers
– Think about confounding variables
– Think about making proper corrections in hypothesis testing
How do we account for confounding variables?
In a testing situation, we try to implement something called random assignment
Scope of Inference
– Do we have random assignment?
– Do we have a random sample?
Random Assignment
– Yes: Changes in Y are caused by X
– No: There is a relationship between X and Y
Random Sample
– Yes: Infer our results to a larger population
– No: Infer our results to our sample or a similar sample
Takeaway
– Just because something is published doesn’t mean it’s correct
– Don’t deny… but learn to critically ask questions
– We as researchers have a responsibility to write results accordingly
ae-21
Hypothesis testing for a difference in means
– Bootstrap
– Theory Based
