Exam-2-Review
Lecture 24?
Dr. Elijah Meyer
Duke University
STA 199 - Spring 2023
April 14th, 2023
Checklist
– Clone exam-2-review-s23
– HW-6 (Statistics Experience) due April 28th
– Project Final Report (April 28th)
– Project Presentations (April 25th)
– Second Peer Evaluation (April 14th by 5:00 PM)
– Exam 2 starts April 14th at 5:00 PM
– Good Conversation in Slack! Check it out
Early AEs
– If you have unstaged changes…. go back and push them
Project Clarifications
Methodology
– The methodology section should include visualizations and summary statistics relevant to your research question. You should also justify the choice of statistical method(s) used to answer your research question.
– EDA is not a statistical method
– Fitting a model; hypothesis test; confidence interval
Exam Rules
Same as Exam 1
– Individual Exam: Don’t Cheat
– Clarification Questions on Slack in #exam-2 channel
– Questions are cumulative with a focus on Unit 2
– No Lab Tuesday (April 18th)
– Exam Due 11:59 (April 18th)
Warm Up: Discussion
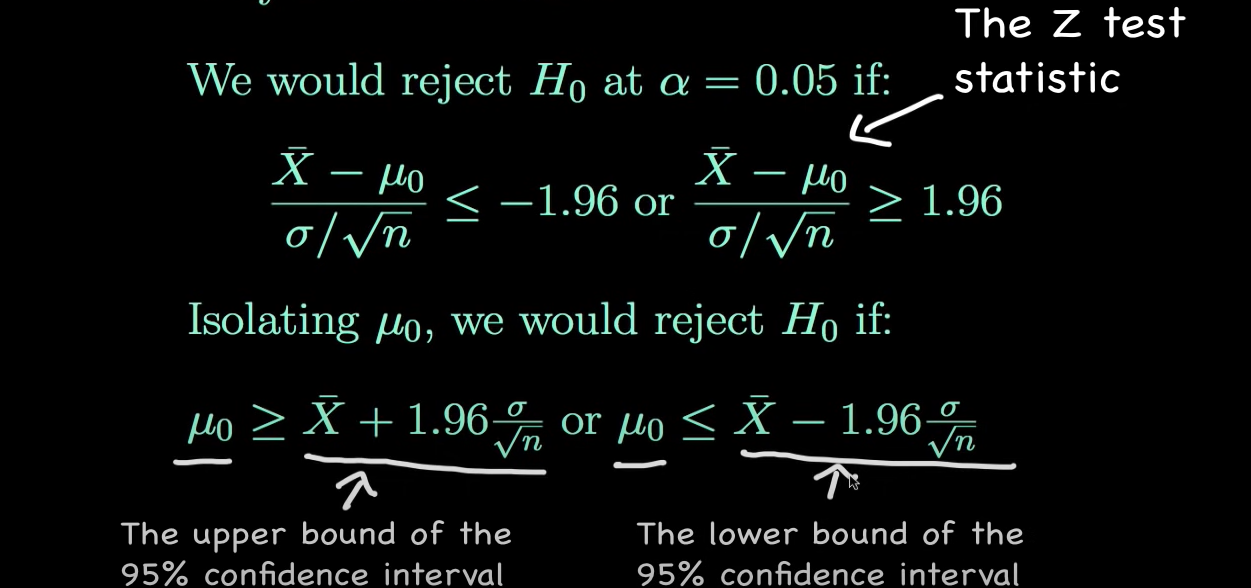
Confidence Intervals and Hypothesis Tests are related…. here’s how
Warm Up:
– (1 - \(\alpha\))100% Confidence Interval
Confidence Interval: statistic \(\pm\) z* x \(\frac{\sigma}{\sqrt(n)}\)
Hypothesis Test: \(\frac{statistic - null}{\frac{\sigma}{\sqrt(n)}}\)
The standard deviation (spread) of the distribution is the same.
Warm Up
Takeaway
A 95% confidence interval is associated with a two-sided hypothesis test at the \(\alpha\) = 0.05 level
Goals Today
– Review
We have covered a lot
This review is going to focus on confidence intervals, and hypothesis testing
These are not all that we’ve covered as it not meant to be an exhaustive review
Confidence Intervals and Hypothesis Testing
– What do they help us accomplish?
Confidence Intervals
– Help us estimate the population parameter of interest
– Gives us plausible values of what our population parameter could be
So what is our population parameter?
Population Parameter
– The variables we are interested in dictate our population parameter and sample statistic
– Single Quantitative Variable: \(\mu\)
– Single Categorical Variable: \(\pi\)
– Categorical Explanatory and Quantitative Response: \(\mu_1 - \mu_2\)
– Categorical Explanatory and Categorical Response: \(\pi_1 - \pi_2\)
Sample Statistic
– Single Quantitative Variable: \(\bar{x}\)
– Single Categorical Variable: \(\hat{p}\)
– Categorical Explanatory and Quantitative Response: \(\bar{x_1} - \bar{x_2}\)
– Categorical Explanatory and Categorical Response: \(\hat{p_1} - \hat{p_2}\)
Simulation Methods or Theory Methods?
– Both need Independence
– Theory methods (CLT) has a more strict sample size assumption that needs to be met as well
– These sample size assumptions change based on the variables we are working with
Single Mean (Chapter 19)
– n > 30
Single Proportion (Chapter 16)
– Observe at least 10 successes and 10 failures
Categorical Explanatory; Quantitative Response (Chapter 20)
– \(n_1\) > 30
– \(n_2\) > 30
Categorical Explanatory; Categorical Response (Chapter 17)
– Observe at least 10 successes and 10 failures in each group
Making the confidence interval
– statistic \(\pm\) t/z-score * SE(statistic)
The standard error of the statistic changes depending on the statistic!
t/z-score
– qt
– qnorm
Simulation
– Bootstrap
– Use our data to create a distribution centered at our sample statistic
Hypothesis Testing
– Null Hypothesis
– Alternative Hypothesis
Hypothesis Testing
– Null Hypothesis - what we assume about the population parameter
– Alternative Hypothesis - the research question we ask
Example:
In the exam review, we will be looking at a roller coaster and amusement park database by Duane Marden. This database records multiple features of roller coasters. For the purpose of this activity, we will work with a random sample of 157 roller coasters.
We are interested in investigating if roller coasters after 1970 are faster than those opened before. For this question, we want to test for a difference. Assume speed is measured in mph.
Ho:
Ha:
Theory Based
\(\frac{statistic - null}{se(statistic)}\)
The standard error of the statistic changes based on the statistic
Simulation
One categorical case: “draw”
One quantitative case: “shifted bootstrap”
When we have groups…. Permute!
– Shuffle our data to create null distribution
The Process After
– Find our statistic on the distribution
– Shade in the appropriate area
– Compare p-value to \(\alpha\)
– Write a decision (context of the null)
– Write a conclusion (context of the alternative)
– Can interpret p-value (use definition)