Communicating data science results effectively + Spatial Data
Lecture ??
Dr. Elijah Meyer
Duke University
STA 199 - Spring 2023
April 21st
Announcements
– Clone ae-25
– HW-6 (Statistics Experience) due April 28th
– Project Final Report (April 28th)
– Project Presentations (April 25th)
– Third Peer Evaluation Coming After Presentations
Teaching Evaluation (8-min)
– I take these seriously
– So does Duke
You have been my favorite class to teach
![]()
Project
Link your slides
https://docs.google.com/spreadsheets/d/14tb2xzi5aI6xvRnfm3fgofK9eTb4aLskWl5cofp1EXI/edit?usp=sharing
Presentation Grading
– Content: Is the research question well designed and are the data being used relevant to the research question? Did the team use appropriate statistical procedures and interpret their results accurately?
– Creativity and critical thought: Is the project carefully thought out? Are the limitations carefully considered? Does it appear that time and effort went into planning and implementation of the project?
– Slides: Are the slides well organized, legible, not full of text, featuring figures with legible labels, legends, etc.?
– Teamwork and professionalism: Did the team present a unified story as opposed to independent pieces of work patched together? Did they present well? Does the presentation appear to be well-practiced? Are they reading off of a script in a way that suggests they don’t know what they’re saying? Did everyone get a chance to say something meaningful about the project?
– Time management: Did the team stay within 5 minutes for their presentation? Did they divide the the time well amongst themselves in a way that every team member got a fair share of the time?
Goals for today
– Finish AE-24 material (in AE-25)
– Introduction to Spatial Data Analysis + Map Making
Spatial Modeling Overview
Researchers in many fields are faced with analyzing data with a spatial component. These analyses typically include:
– modeling trends and correlation structures
– estimation of underlying model parameters
– hypothesis testing or model comparison
– prediction of observations at unobserved times or locations
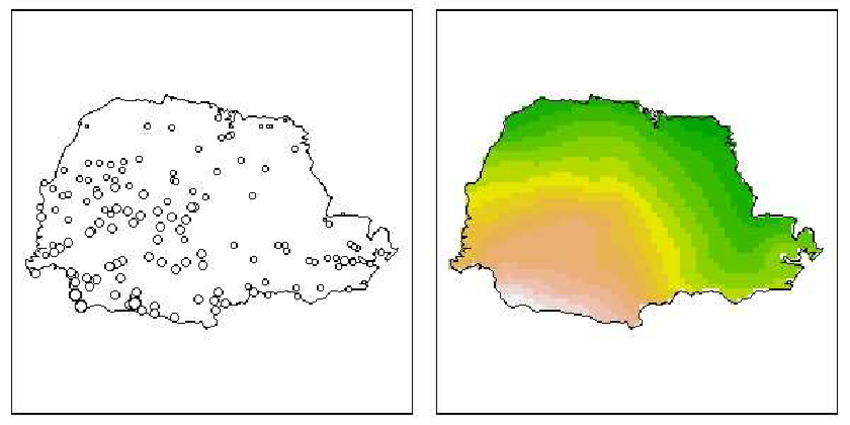
Example
![]()