Bootstrap
Lecture 18
Dr. Elijah Meyer
Duke University
STA 199 - Spring 2023
March 22nd, 2023
Checklist
– Clone ae-17
Announcements
– HW 4 coming today (due in 1 week)
– Lab 7 Due next Tuesday
– Project proposal feedback by Friday
– Peer Review Survey
Peer Review

– Each of you should have received an invite email (reach out to me if you did not)
– Due March 29th at 11:59
– Answers will be private
– Encouraged to have conversations with groupmates if things are not going well
Peer Review Purpose
– Accountability
– Part of your grade
Project
Feedback
– Feedback can be seen in **Issues* tab
– Expectation is to respond to feedback on data set you choose for your project
Issues

– See lab 7 on how to respond + close issues created by myself and lab leaders
– Project Draft Report is Due April 7th
Project Tips
– Own your work vs “that part wasn’t mine”
– Research Question
— Can you answer it?
– Introduction
— Do not copy + paste the description given on the website
— Do some digging
— Write a brief description of the observations.
— Address ethical concerns about the data, if any.
Project Highs
– Really impressed with mini literature review
– Creative + interesting research questions
– I look forward to what you do next!
Project Draft Report
– Introduction and data
– Methodology
– Results
– W+F
— update about section
— Respond to all issues from chosen data set
— Everyone is your group must have at least 3 commits
Where we are going
\(\checkmark\) Data Viz
\(\checkmark\) Probability
\(\checkmark\) Modeling Data
– Estimating population parameters (confidence intervals)
– Testing population parameters (hypothesis testing)
Goals
– Quick re-run through of ROC curves
– What is bootstrapping?
– What is a confidence interval?
ROC Curves
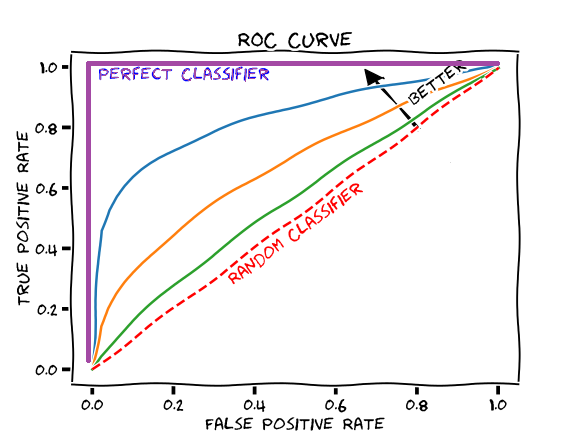
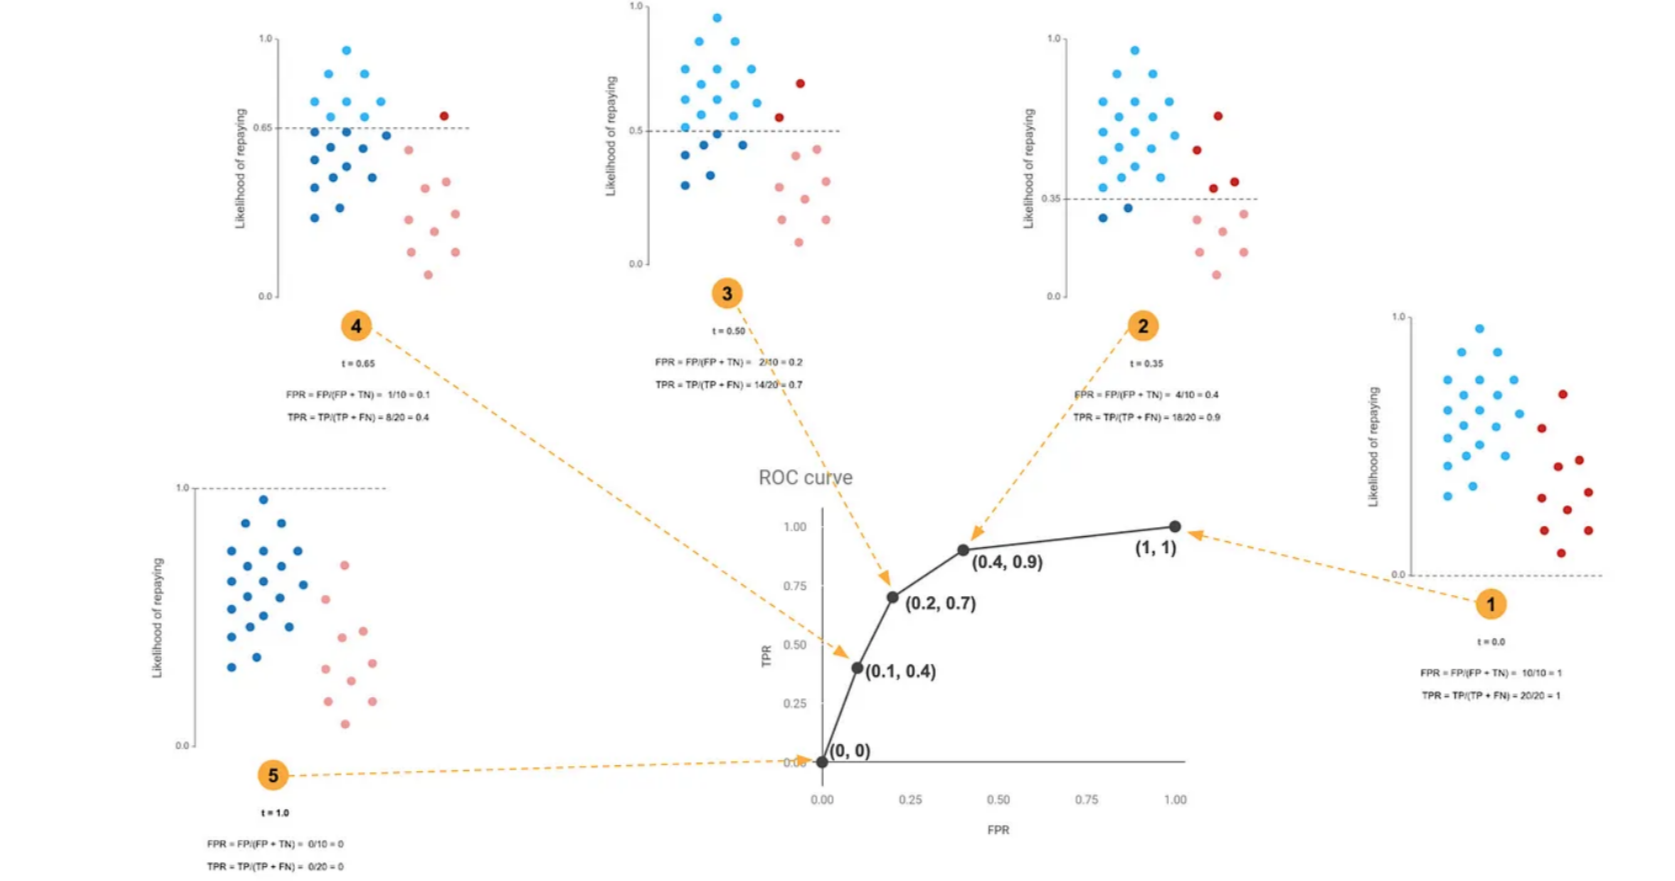
Plot of a model’s true positive and false positive rates based on a testing data set
– Used for model evaluation (AUC)
– Can be used to help pick a threshold to make decisions
ROC Curve

ROC creation

AE-16
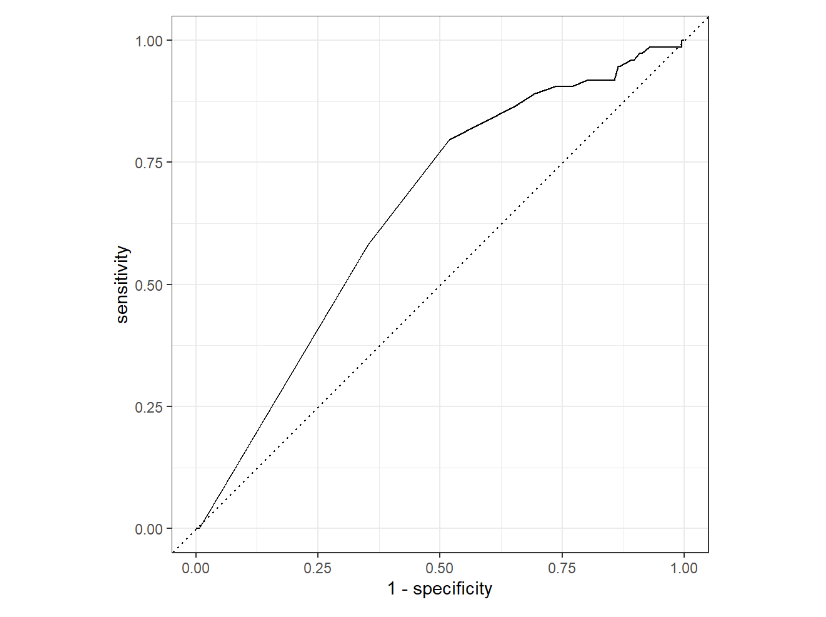
Predict spam based on number of exclamation points + winner

AUC ~ 0.650
Picking a threshold
email_pred |>
  roc_curve(
    truth = spam,
    .pred_1,
    event_level = "second" #a success
) 
Confidence Intervals
– are a range of plausible values that our population parameter could be
— and we almost always don’t actually know what this value is …. but we want to!
Confidence Intervals
By the end of class, we will
– know how to calculate confidence intervals using bootstrap methods
– understand what bootstrap methods are
– understand how the level of confidence influences our confidence interval
– understand how to interpret a confidence interval in the context of the problem
ae-17
In Summary
Bootstrap methods are simulation methods
Variability - Uncertainty: How spread out your data are
We can use this to guess plausible values around our parameter of interest
This is called a confidence interval, and it’s different than probability
