Prediction
Lecture 16
Dr. Elijah Meyer
Duke University
STA 199 - Spring 2023
March 10th, 2023
Checklist
– Clone ae-16
Announcements
– HW 3 due Friday (3-10)
– Project Proposal due Friday (3-10)
– Statistics Experience (HW 6)
Data Fest 2023 at Duke
– data analysis competition where teams of up to five students attack a large, complex, and surprise dataset over a weekend
– DataFest is a great opportunity to gain experience that employers are looking for
– Each team will give a brief presentation of their findings that will be judged by a panel of judges comprised of faculty and professionals from a variety of fields.

Warm Up
What are some of the key difference between logistic regression and linear regression?
Key Differences
– Different response variables
– Modeling means vs log - odds (probabilities)
Further Differences: Model Selection
– Linear Regression: R-squared; Adjusted-R-Squared; AIC
– Logistic Regression: AIC; (What we do today)
Situation
Want to build a model that predicts well.
– How do we build it?
– How do we know if it predicts well?
Goals
– Assess how good your model is at prediction
– Visualize how well your model predicts new observations
Vocab
– Testing Data Set
– Training Data Set
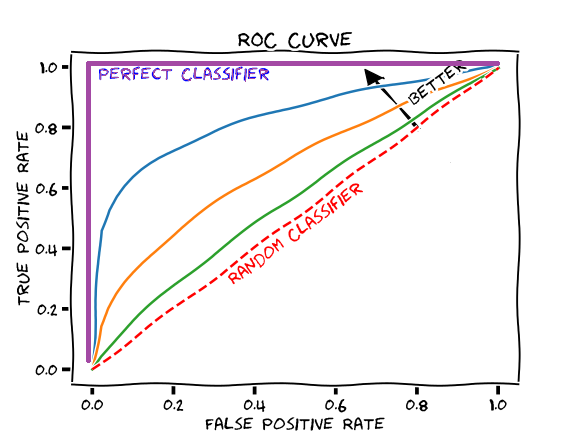
– ROC Curve
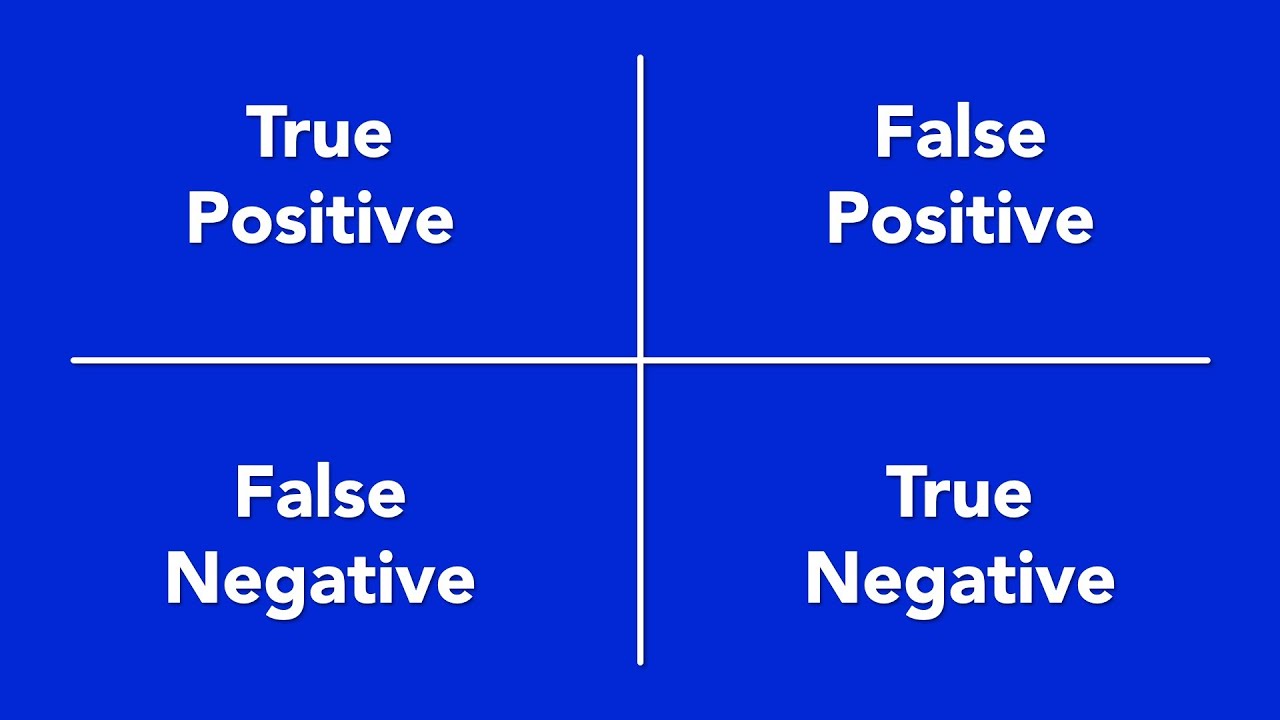
– Sensitivity (True Positive)
– Specificity (True Negative)
Splitting the data
When the goal is prediction….
– When able, it may be advantageous to withhold a part of your data when creating your model
– Can use what’s withheld to evaluate how well your model predicts
Training Data Set
– training data is the dataset you use to build your model
– roughly 80% of a larger data set
“Sandbox” for model building.
Testing Data Set
– data to be used to evaluate your model
– evaluate the predictive performance
– roughly 20% of the larger data set
Important Note
– Training and Testing data sets are created at random
Why this matters
We can think about the reason we model data
– Make predictions for new observations
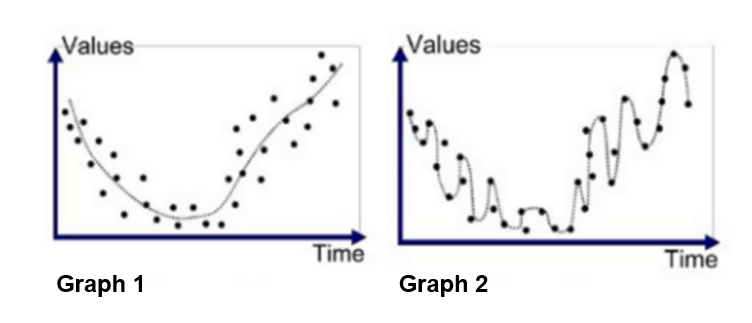
Which model would you prefer?

Model Selection tools
– can most definitely select an overfit model
Overfitting
– Overfitting is a concept in data science, which occurs when a statistical model fits exactly against its data.
– This doesn’t make sense if are goal is to predict!
Plotting predictive performance

True Positive Rate
– Also known as sensitivity
– Probability of correctly detecting a “success”
False Negative
– Incorrectly predicting a “failure”
– 1 - specificity
Where specificity is the percentage of true negatives
ae-17
In Summary
– We can use a testing + training data set to evaluate models
– We can use ROC curves when working with prediction + logistic regression
– We can assess linear regression models by looking at how well we predict + check assumptions like constant variance of residuals
For Next Time

