Model Selection
Lecture 15
Dr. Elijah Meyer
Duke University
STA 199 - Spring 2023
March 3rd, 2023
Announcements
– W+F Grading Mistake on Exam (Will be fixed soon)
– HW-3 Due Wednesday: March 8th (11:59)
– Lab 5 due Tuesday March 7th (11:59)
– Project Proposal due Friday: March 10th (11:59)
– Exam 2 being moved from April 7th (likely to the following Friday)
— Lab-6 is a project proposal work day
Announcements: HW-3
– Linear trend line = linear line of best fit
– Question 3 wording changed to be more clear
– Question 5 wording changed to be more clear
– Question 8 wording changed to be more clear
– Due date moved back to Friday
Group Dynamic
– Are you communicating?
– Are expectations clear?
– Everyone needs to contribute
Group Dynamic
– If not, reach out to your lab leader
– A student’s name does not go on any submission where they do not contribute nor communicate with other group members
– Group Evals
Warm Up
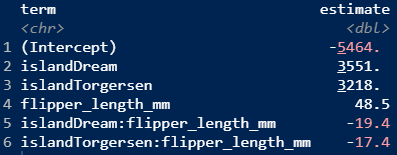
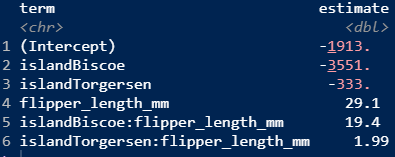
Why are these sets of model output different?
Goals
How do we choose?
– compare models with a different number of predictors
Model Selection
We have fit many models to analyze the body mass of penguins. Today, we will go over strategies to figure out which model is “the best”.
Model Selection
The best model is not always the most complicated
– Review: Why we shouldn’t use R-squared
– Adjusted R-squared
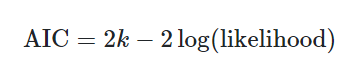
– AIC
– Stepwise selection
R-squared
tells us the proportion of variability in the data our model explains. If we add predictors to our model, r-squared will NEVER go down (regardless of whether the predictor is good or not).
R-squared
– Demo this in AE-15
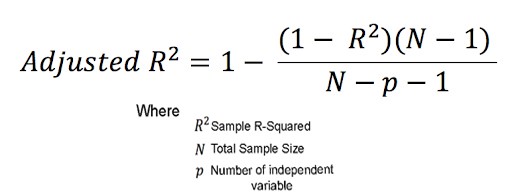
Adjusted R-squared
What is it?
How is this different that R-squared?
Adjusted R-squared
![]()
Adjusted R-squared
Does not have same interpretation as R-squared
Generally defined as strength of model fit
Our best guess if one model is better than the other is when one model has a higher adjusted R-squared
Model Selection Take-away
– Higher adjusted r-squared = Better fit / preferred model
– Lower AIC = Better bit / preferred model
– We can get at this information using glance in R
– Prior to the selection of models, choose one criteria and stick with it
Stepwise selection
Backward elimination starts with the full model (the model that includes all potential predictor variables. Variables are eliminated one-at-a-time from the model until we cannot improve the model any further.
Forward selection is the process of adding variables one-at-a-time; we add variables one-at-a-time until we cannot find any variables that improve the model any further.
- Often use AIC and adjusted R-squared as criteria for stepwise selection
Important
Alternatively, one could choose to include or exclude variables from a model based on expert opinion or due to research focus. In fact, many statisticians discourage the use of stepwise regression alone for model selection and advocate, instead, for a more thoughtful approach that carefully considers the research focus and features of the data.
In Summary
R^2 doesn’t let us compare between models with a different number of predictors
We can compare models with a different number of predictors by penalizing the existence of each predictor in the model.