More Multiple Linear Regression
Lecture 14
Dr. Elijah Meyer
Duke University
STA 199 - Spring 2023
March 1st, 2023
Checklist
– Clone ae-13
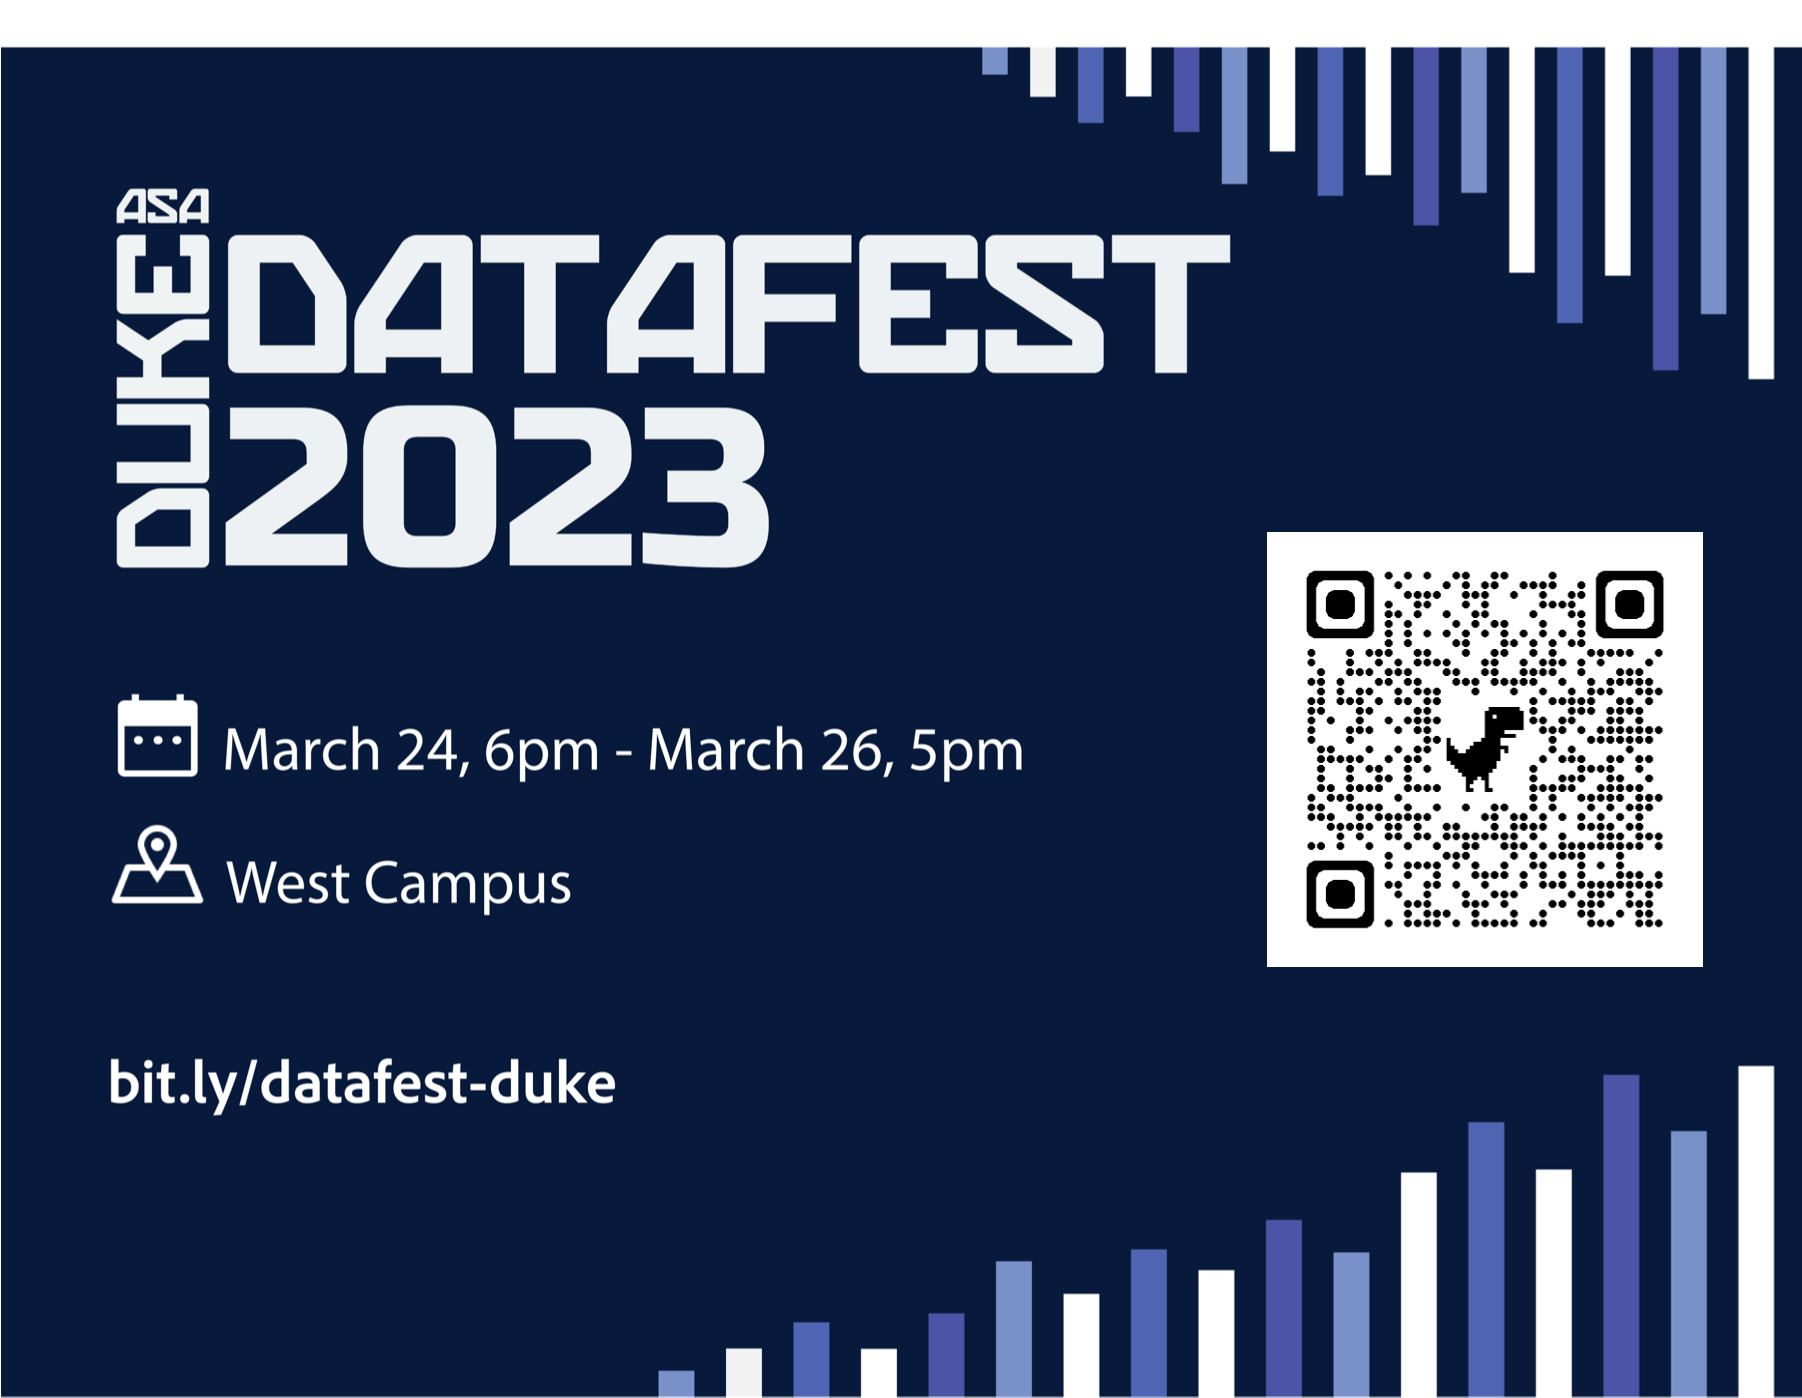
Data Fest 2023 at Duke
– data analysis competition where teams of up to five students attack a large, complex, and surprise dataset over a weekend
– DataFest is a great opportunity to gain experience that employers are looking for
– Each team will give a brief presentation of their findings that will be judged by a panel of judges comprised of faculty and professionals from a variety of fields.
Announcements
– HW-3 Due Wednesday: March 8th (11:59)
– Lab 4 due Tuesday March 7th (11:59)
– Project Proposal due Friday: March 10th (11:59)
— 1 submission. Attach everyone to it
Project Highlights
– The final project for this class will consist of analysis on a dataset of your own choosing.
– The goal of this project is for you to demonstrate proficiency in the techniques we have covered in this class (and beyond, if you like) and apply them to a novel dataset in a meaningful way.
Project Highlights
– A project proposal with three dataset ideas.
– A reproducible project writeup of your analysis, with one required draft along the way.
– Formal peer review on another team’s project.
– A presentation with slides.
Project Turn-In
You will not be submitting anything on Gradescope for the project. Submission will happen on GitHub and feedback will be provided as GitHub issues (more on this in a future lab) that you need to engage with and close.
Project Repo
You have a team project repo to work in. The collection of the documents in your GitHub repo will create a webpage for your project. To create the webpage go to the Build tab in RStudio, and click on Render Website.
For your proposal
– 3 data sets that you find interesting
– One research question for each
– Literature
– glimpse of data
Goals
More with modeling
– Model with multiple predictors
Warm Up
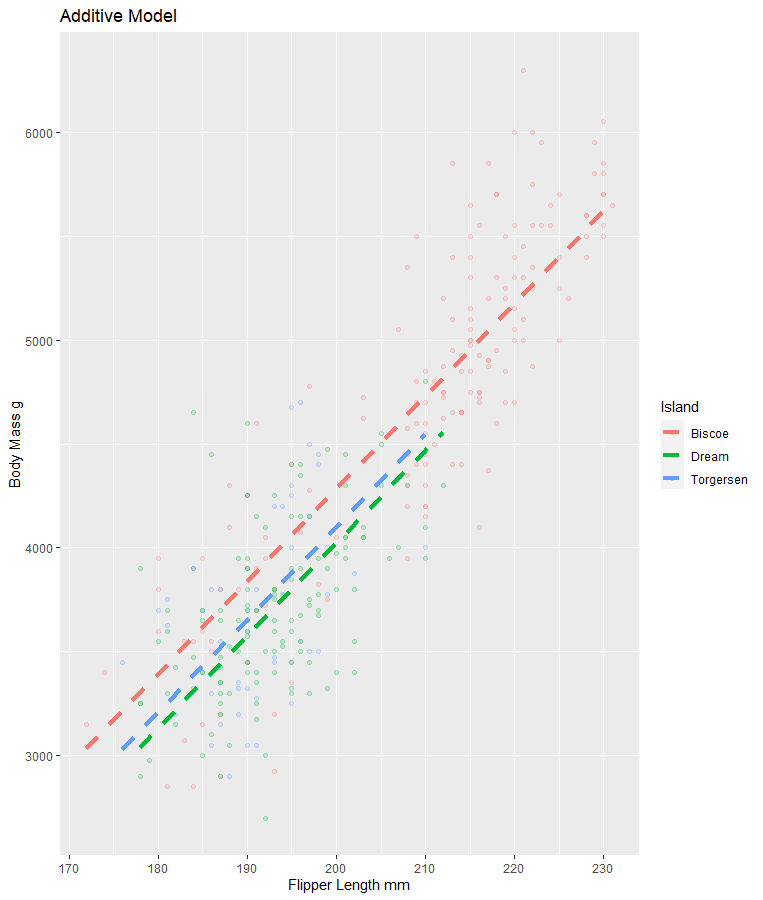
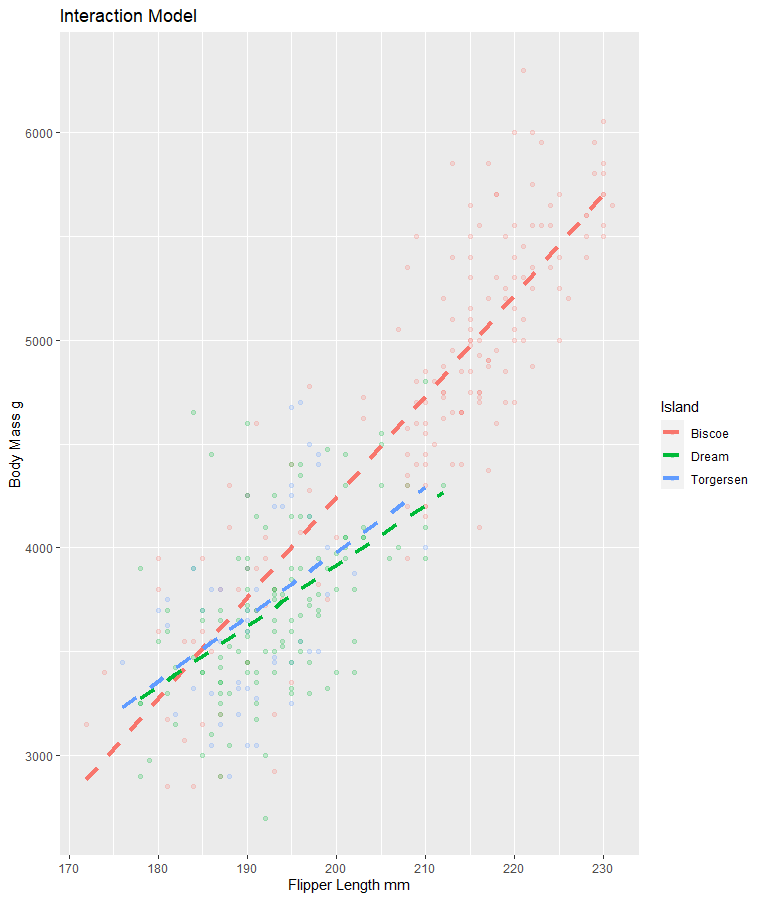
What is the difference between an interaction model and an additive model?
Warm Up
ae-13
– Start ae-13
– Fit the interaction model between island, flipper length, and body mass in R
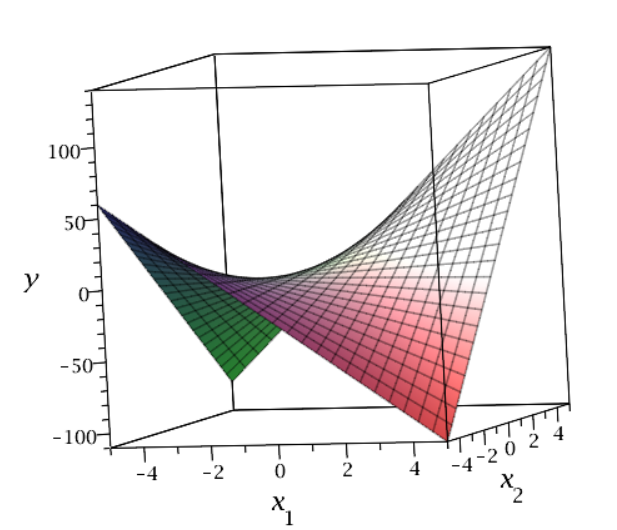
Interaction with 2 Quan Xs
R-squared (coefficient of determination)
– How much variability in Y is explained by our model
Variability
“How spread out your data are”
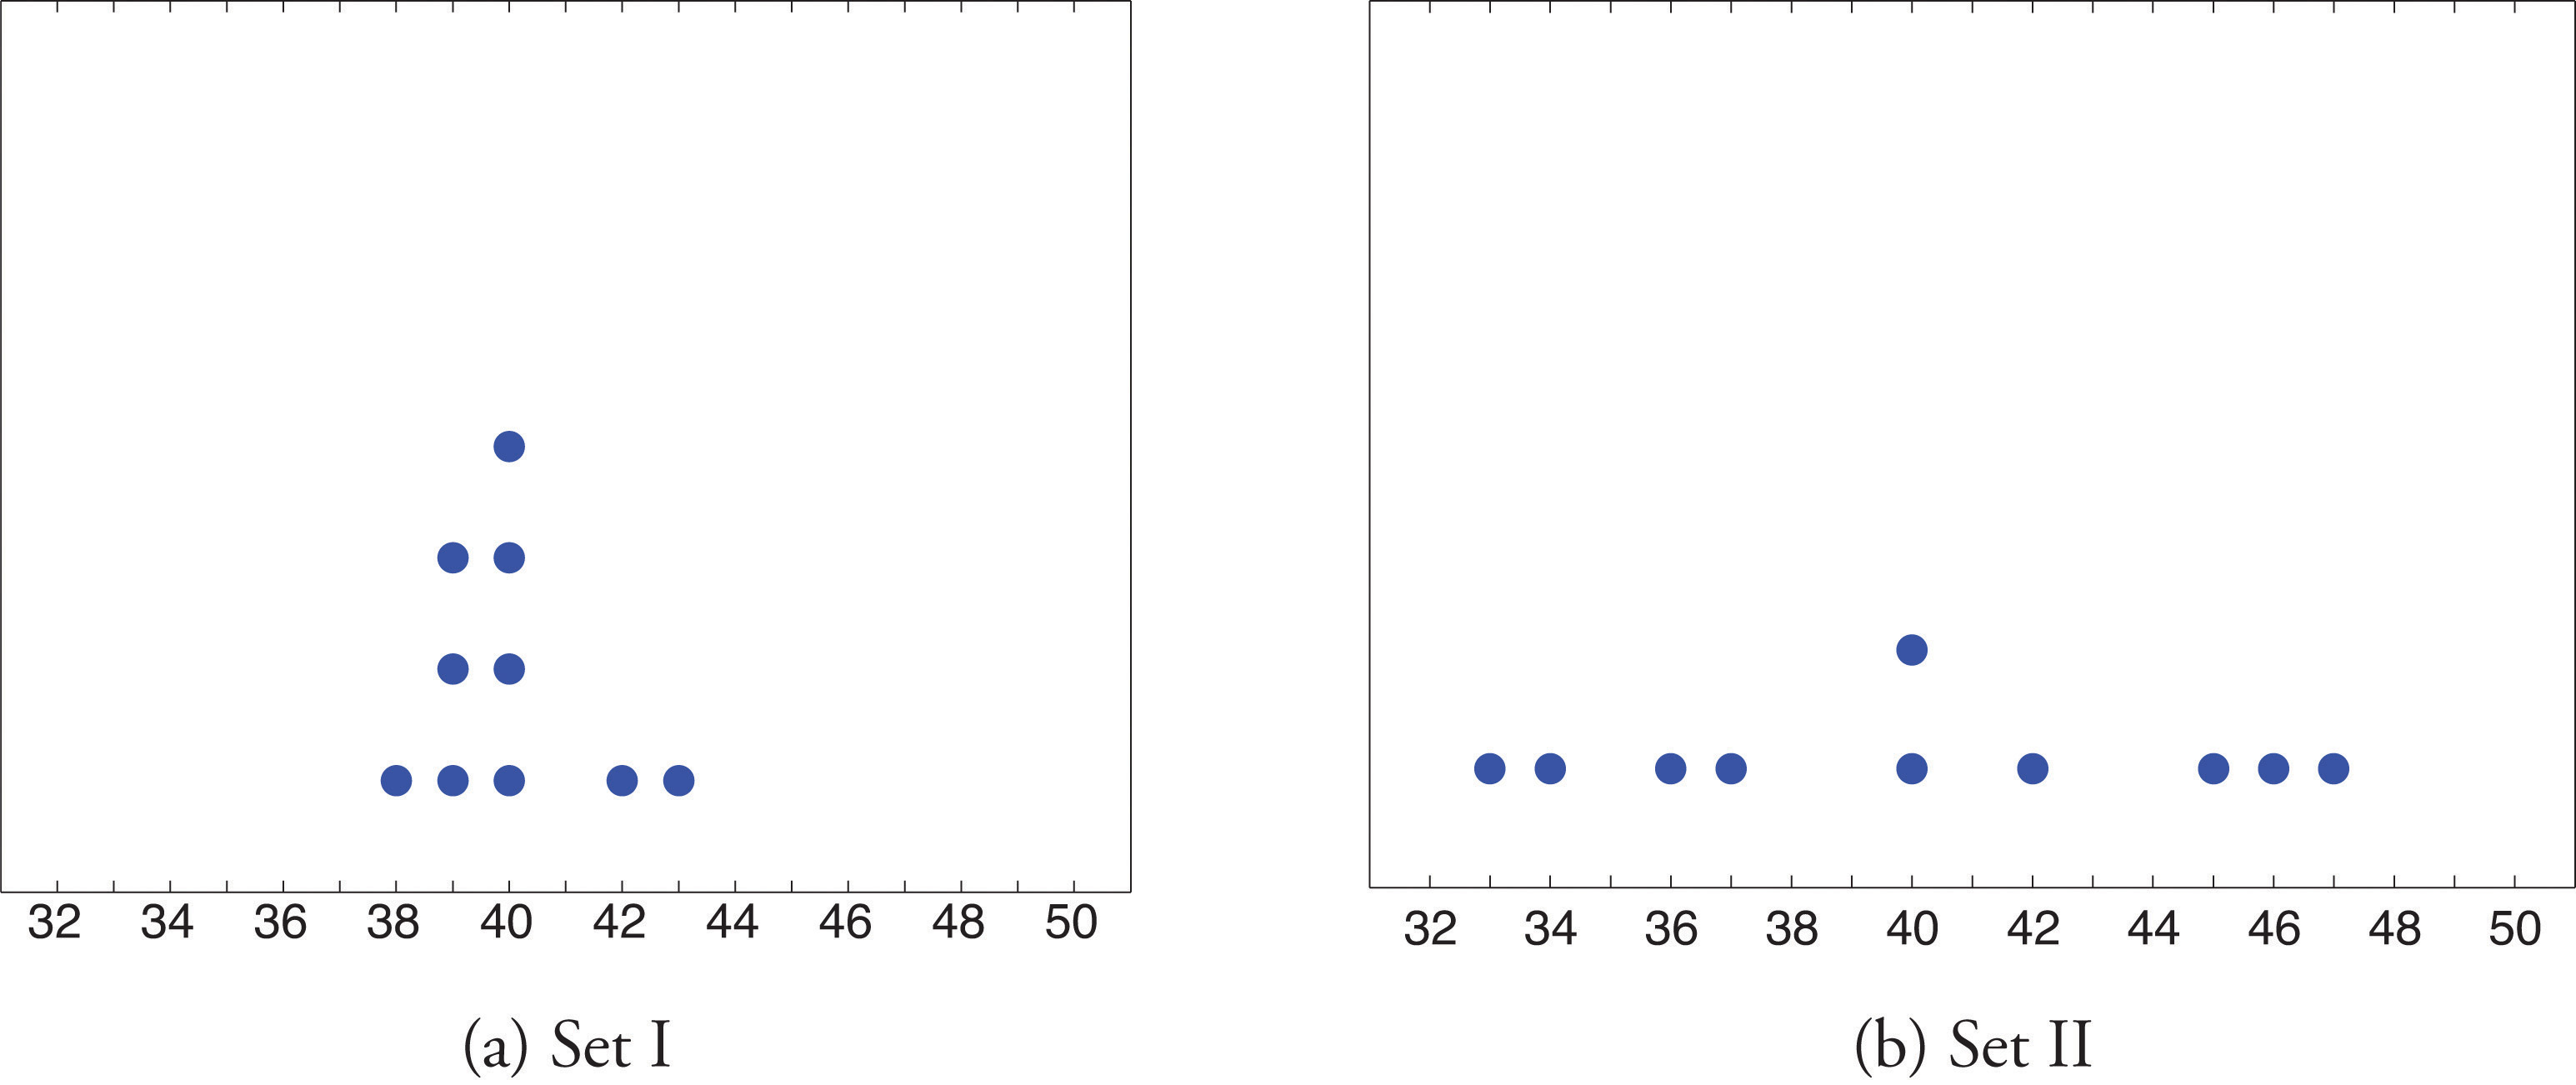
R-squared (coefficient of determination)
\(\frac{Sums of Square Total - Sums of Square Residuals}{Sums of Square Total}\)
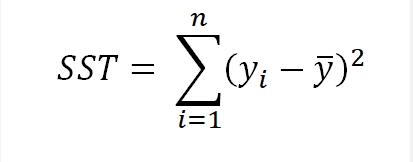
Draw it out (SLR Case)
Model Summary
– Reveal Patterns not evident in graphs
– BUT … can also impose structures that are not really there…..
– General Rule:
— Be a skeptic
— Fit an appropriate model
In Summary
– SLR vs MLR
– Additive vs Interaction
– Predict
– Interpret
Moving Forward
– How do we choose our “best” model?
– What is the response variable is categorical?
