SLR + MLR
Lecture 13
Dr. Elijah Meyer
Duke University
STA 199 - Spring 2023
Feburary 24th, 2023
Checklist
– Clone `ae-12
– Homework 2 due tonight (11:59)
– Lab 4 due Tuesday (11:59)
— 1 submission. Attach everyone to it
Data Fest 2023 at Duke
– data analysis competition where teams of up to five students attack a large, complex, and surprise dataset over a weekend
– DataFest is a great opportunity to gain experience that employers are looking for
– Each team will give a brief presentation of their findings that will be judged by a panel of judges comprised of faculty and professionals from a variety of fields.

Lab 4
– Team Submission
– Attach ALL team members to submission on Gradescope
– Communicate!
– “It was my responsibility to turn the lab in and I forgot….”
Goals
– Discuss correlation
– Finish categorical single predictor
– Model with multiple predictors
Warm up
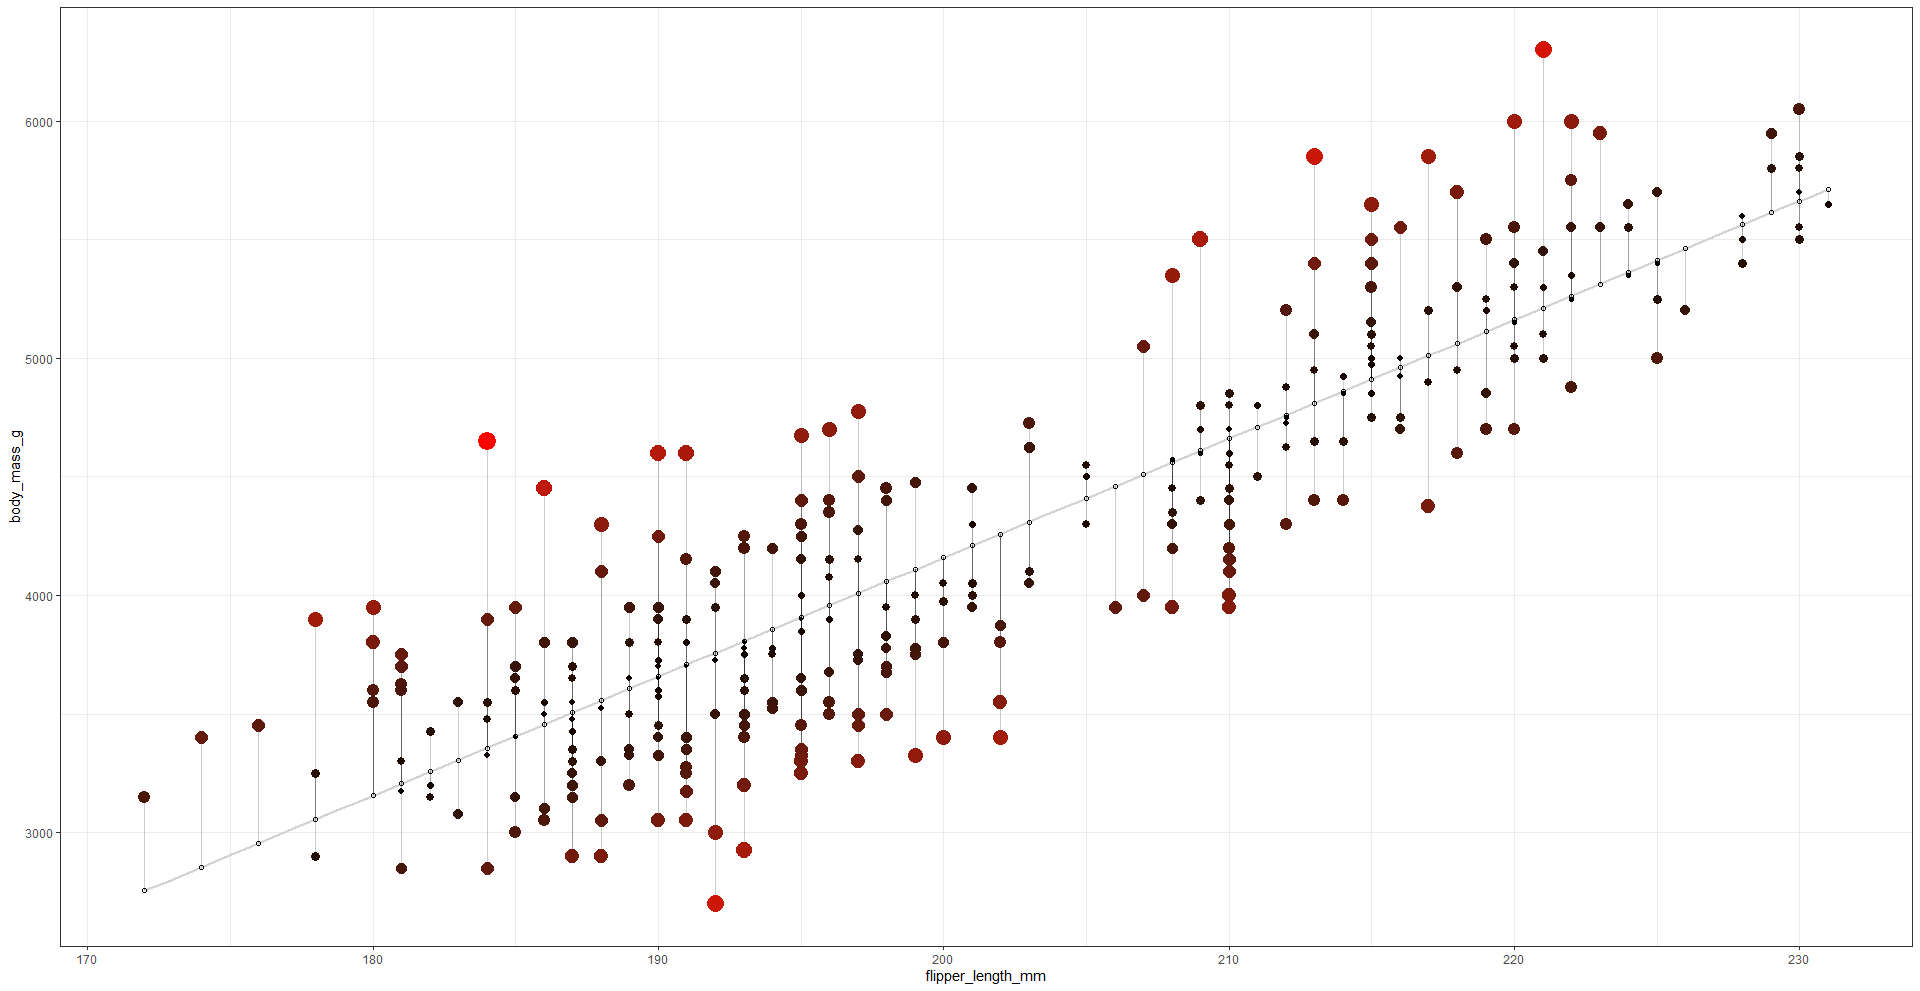
Below is a scatterplot from ae-11. Alone or with a partner, discuss how R chose to fit this line over any other.

Warm up
Correlation
– Proper notation:
— Population correlation: \(\rho\)
— r
Correlation
strength and direction of a linear relationship
bounded between [-1, 1]
The Correlation Game
– Play against yourself
– Be better at correlation than your friends
https://www.rossmanchance.com/applets/2021/guesscorrelation/GuessCorrelation.html
Correlation
Can find this with the cor or correlate function in R

https://www.tidyverse.org/blog/2020/12/corrr-0-4-3/
Models
Single Predictor - Categorical Variable
ae-12
Multiple Linear Regression
estimates the relationship between a quantitative response variable and two or more explanatory variables
motivated by scenarios where many variables may be simultaneously connected to an output
Multiple Linear Regression
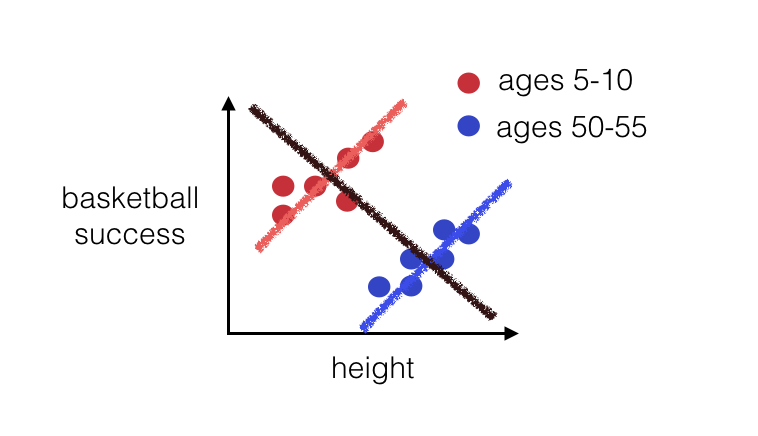
Additive Model vs Interaction Model
In words….
The relationship between x and y do not change based on the values of z (additive)
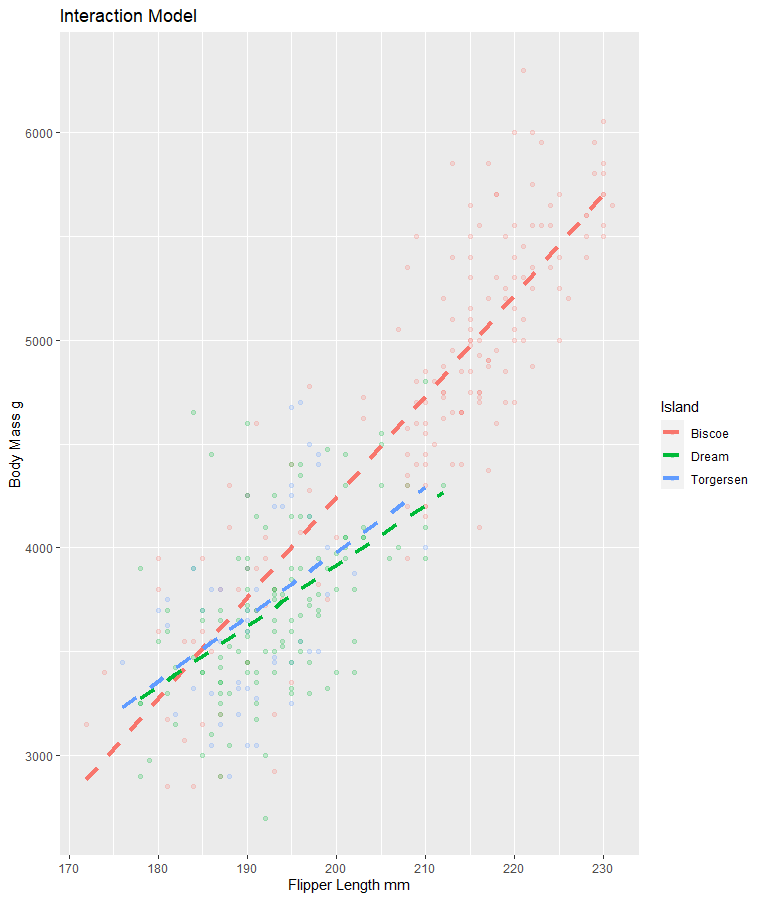
The relationship between x and y DO change based on the values of z (interaction)
Additive Model for Today
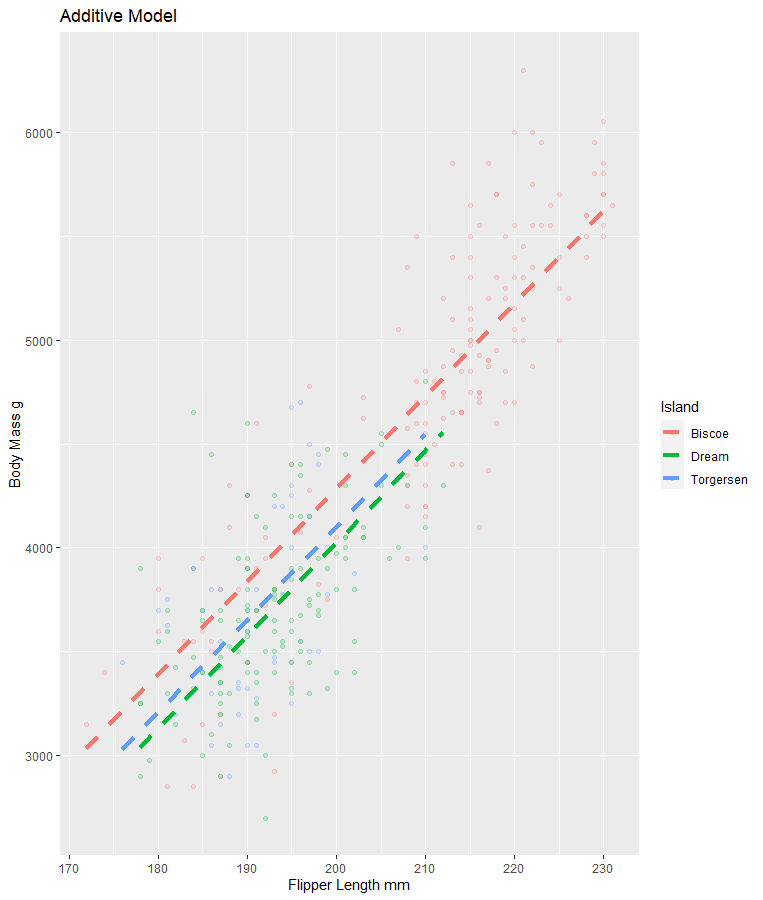
Interaction Model for Today
Principle of parsimony (Occam’s Razor)
for a statistical model states that: a simpler model with fewer parameters is favored over more complex models with more parameters, provided the models fit the data similarly well
KEEP IT SIMPLE (when you can)
So how do we choose?
Many different ways
– Initial visual evidence
– R-squared & Adjusted R-squared
R-squared
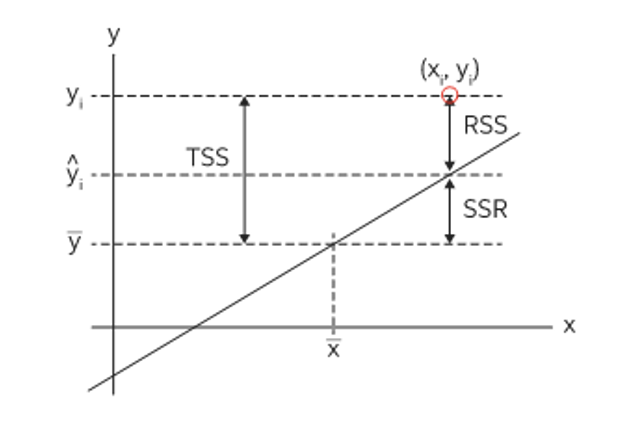
– statistical measure in a regression model that determines the proportion of variance in the response variable that can be explained by the explanatory variable(s).
R-squared
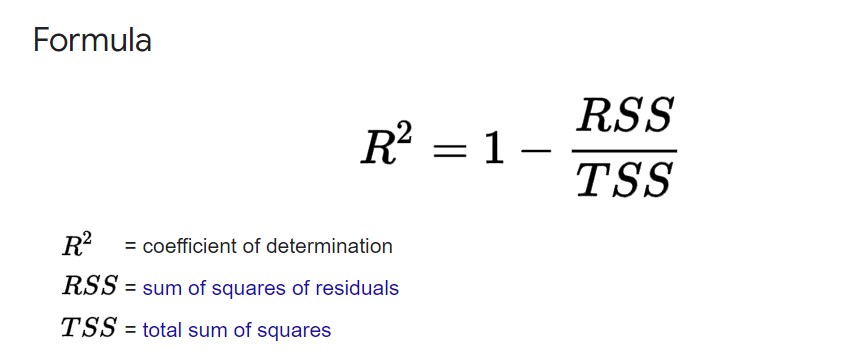
R-squared
R-squared: Takeaway
– statistical measure in a regression model that determines the proportion of variance in the response variable that can be explained by the explanatory variable(s).
– The more variables you include, the larger the R-squared value will be (always)
Adjusted R-squared
Takeaway: Adds a penalty for “unimportant” predictors (x’s)

