Debugging + ggplot practice
Lecture 8
Dr. Elijah Meyer
Duke University
STA 199 - Spring 2023
Feburary 8th, 2023
Checklist
Clone your ae-07 project in RStudio
Are you working on data wrangling exam practice?
Exam Review - Friday Class Topics + Structure
Groups are coming after Exam 1
Announcements
– Exam Review - Friday Class Topics + Structure
– Project Groups + Class Feedback
Announcements
– Exam 1 - Feb 10th
– Lab 3 due Friday 5:00 PM
– Lab 1 Exercise 2 (x and y variables on plot)
– Videos + Readings + Labs + Class
Exam Instructions
– You must submit a PDF document to Gradescope
– With the exception of major emergencies, late submissions will not be accepted. A last-minute technical issue is not a major emergency.
– Include appropriate labels, titles, etc. when making any plot.
Exam Instructions
– This is an individual assignment.
– You may post *clarification questions on Slack in the #exam-1 channel.
– Don’t cheat
– You may use R documentation, as well as course materials (notes and textbooks), or existing internet resources to answer exam questions. You may not, under any circumstances, use ChatGPT on the exam. Doing so will result in an 0.
Exam Instructions
– PDF not submitted on Gradescope (-10 points): If a PDF is not uploaded to Gradescope by the submission deadline, the PDF at your latest commit prior to the deadline will be used as your submission.
– If there is no PDF in your repo, i.e., you’ve never rendered your .qmd file, your work will not be graded and you will receive a 0 on the exam.
– Pages not marked on Gradescope (-10 points)
Warm-Up
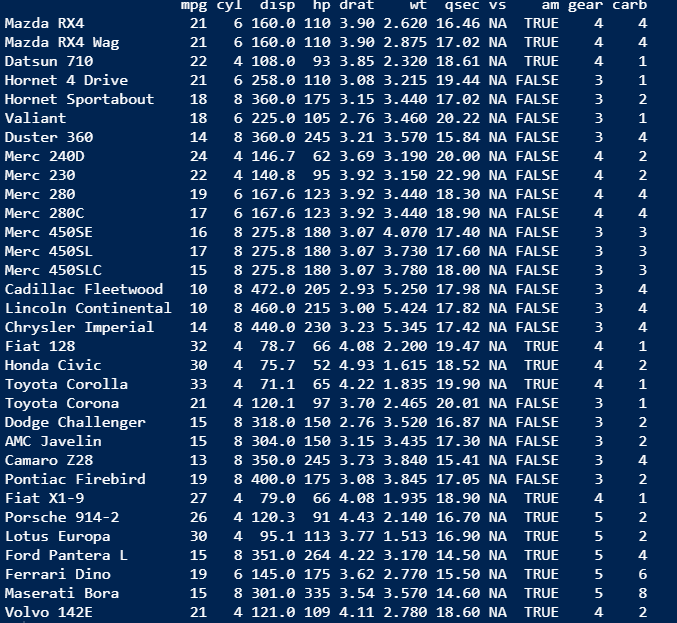
Suppose a researcher wants to subset the mtcars data set to only include cars with 4 and 6 cylinders.
![]()
Warm-Up
Two researchers set out to subset these data using the following code. What’s different? What’s correct?
Researcher 1:
cylinders <- c("6", "4")

mtcars |>
  mutate(cyl = factor(cyl)) |>
  filter(cyl == cylinders)
Researcher 2:
cylinders <- c("6", "4")

mtcars |>
  mutate(cyl = factor(cyl)) |>
  filter(cyl %in% cylinders)
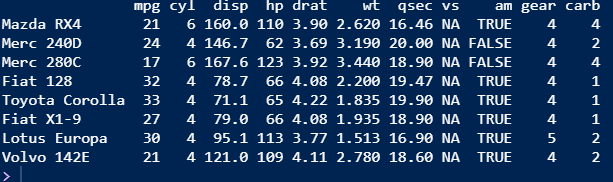
Warm up
cylinders <- c("6", "4")

mtcars |>
  mutate(cyl = factor(cyl)) |>
  filter(cyl == cylinders)
![]()
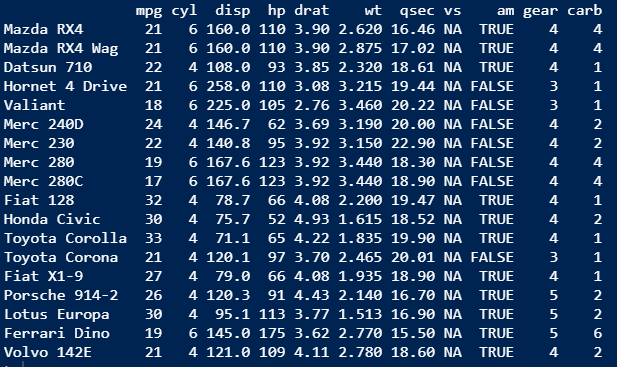
Warm up
cylinders <- c("6", "4")

mtcars |>
  mutate(cyl = factor(cyl)) |>
  filter(cyl %in% cylinders)
![]() }
}
Not seeing my changes in Git
– You can see the project you are working in in the top right corner of your screen. This MUST be the project that you cloned for the exam / assignment / lab. Do not use the files tab to go search for a file outside of your project repo.
Tips for not rendering
– External viewer error?
– Did you put View() in a code chunk? We don’t use View often, but we need to be aware that any function that calls for an external viewer will break the render.
Tips for not rendering
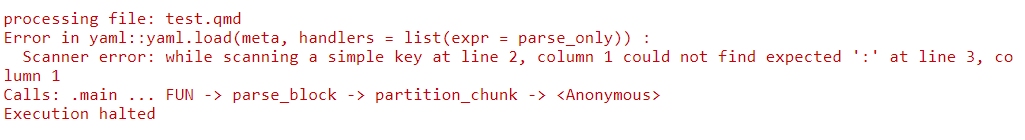
- Something wrong with your code chunk arguments?
Expected :
![]()
![]()
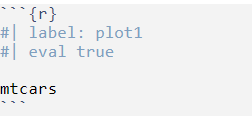
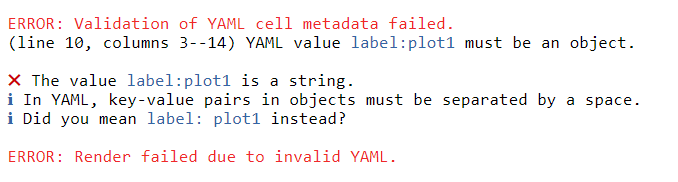
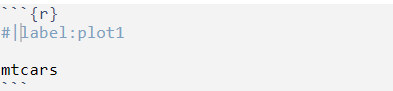
Spacing
![]()
![]()
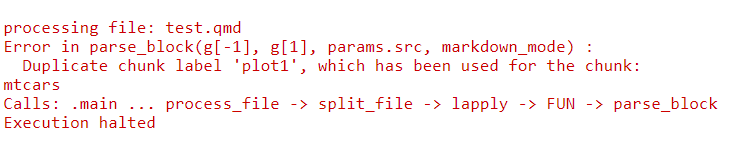
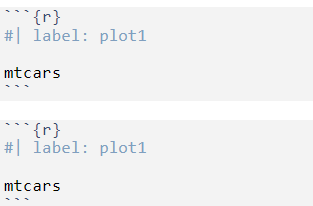
Duplicate labels
![]()
![]()
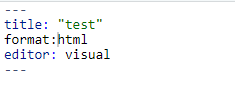
Something in the YAML
– The YAML is the metadata that tells Quarto exactly how to process or display the document. This happens in the first few lines of the document between the tick marks.
![]()
![]()
Tips for not rendering
— Does your code run? If you have errors in your code, you will also have errors when rendering the document.
Error should give you an idea about where the error is occurring.
If error can’t be found, go through question by question to find it.
General Strategies
– Help files (?function.name)
– https://ggplot2.tidyverse.org/reference/index.html
– Slack
– Keys
– Google
ae-07
– We will start with the debugging qmd.
Goal

 }
}