Pivot + Tidying data
Lecture 7
Dr. Elijah Meyer
Duke University
STA 199 - Spring 2023
Feburary 3rd, 2023
Checklist
Clone your
ae-06project in RStudioLab 2 due Tuesday 2-7
Don’t work on Lab-2 during Lab-3
Groups are coming after Exam 1.
Announcements
– Data Wrangling Practice
– Exam 1 - Feb 10th
– Friday Review (Survey Coming on Sakai)
Goals:
– ggplot practice
– Practice re-creating graphs
– Understand pivot_longer
– Understand pivot_wider
Warm Up
– In ae-06 project, open up ae-05-fisheries.qmd.
– Run every code chunk up until: Warm up starts here!
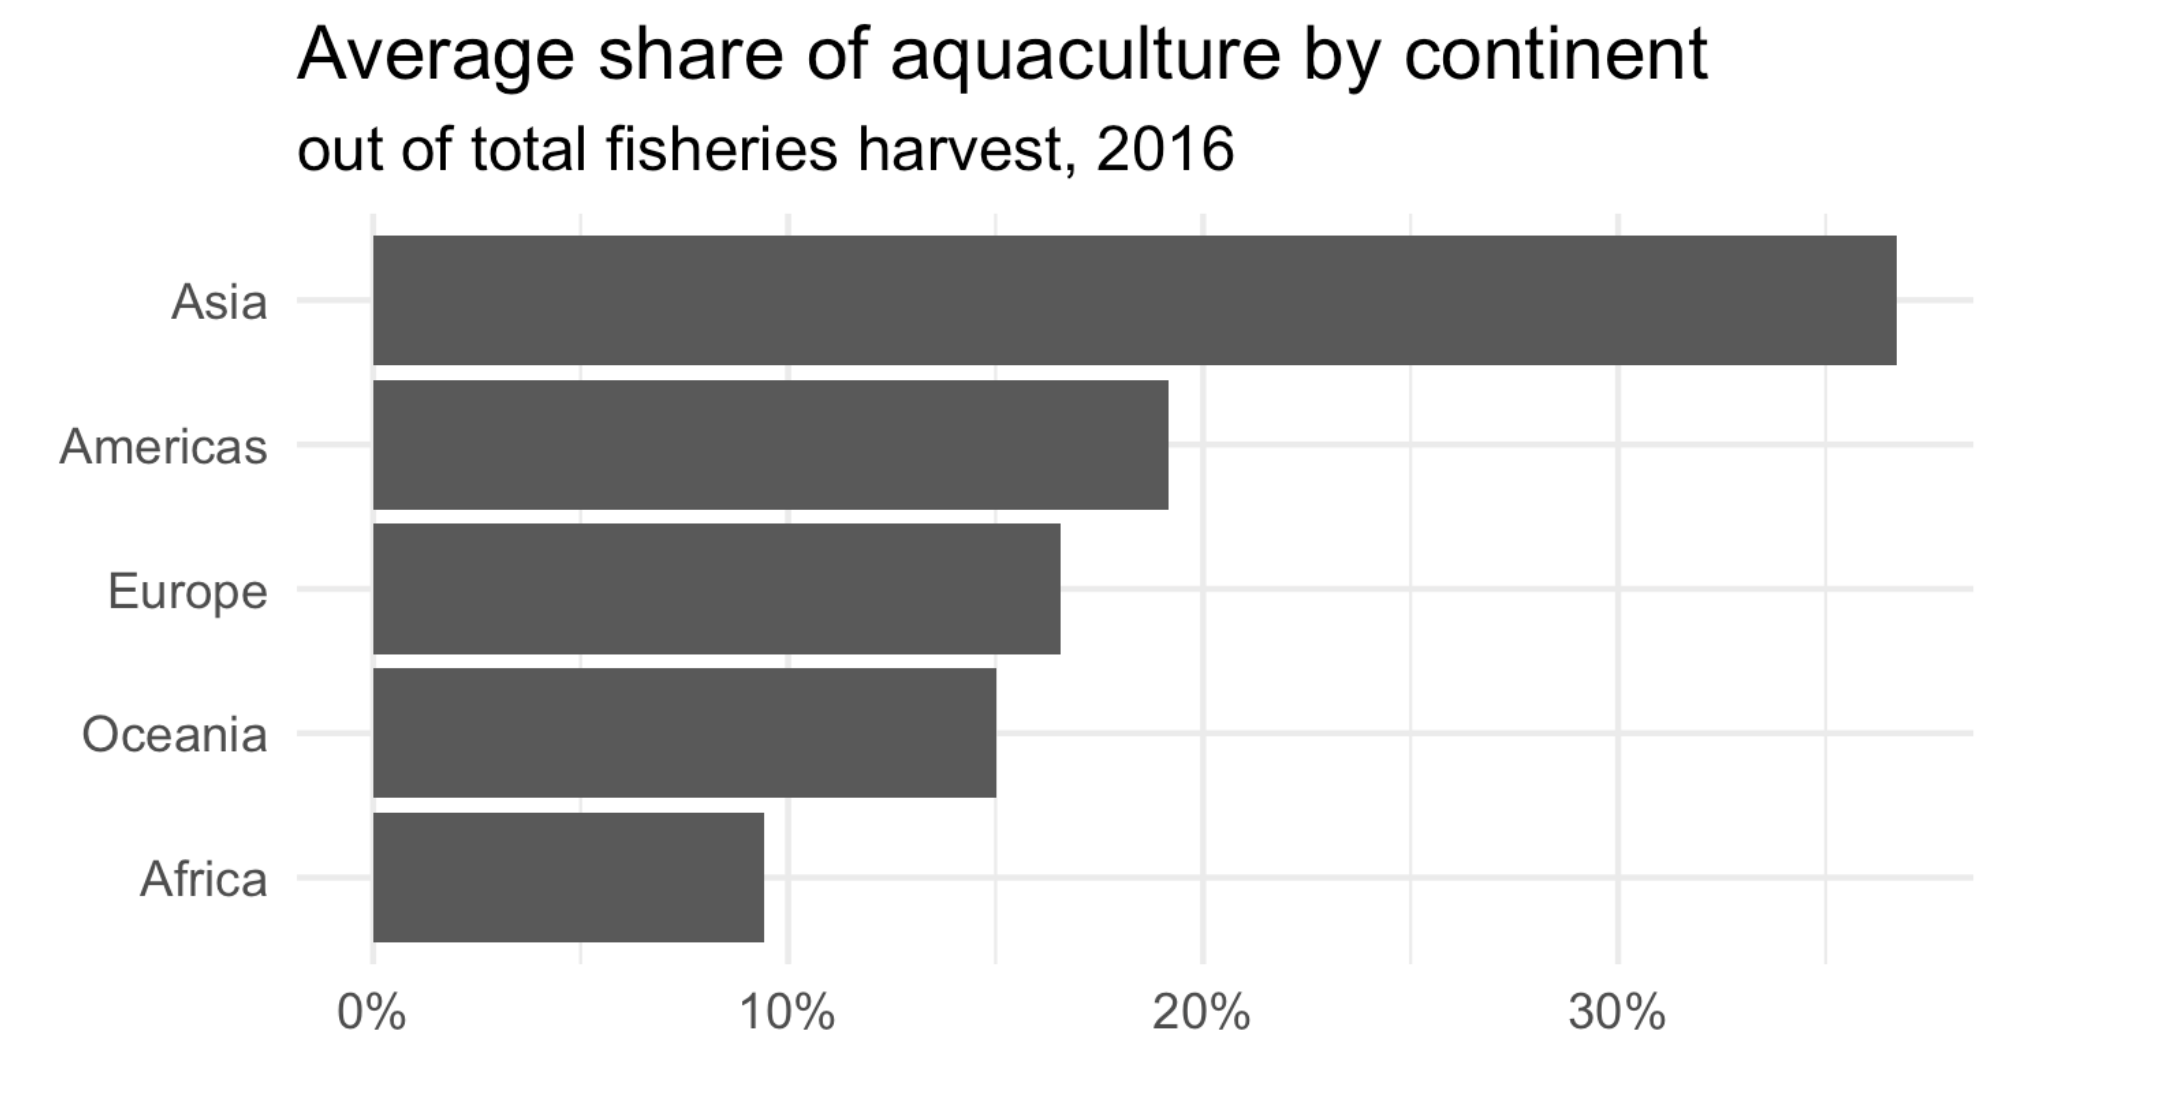
– Recreate the following plot below using the fisheries_summary data set.

Data Format (Wide vs Long)
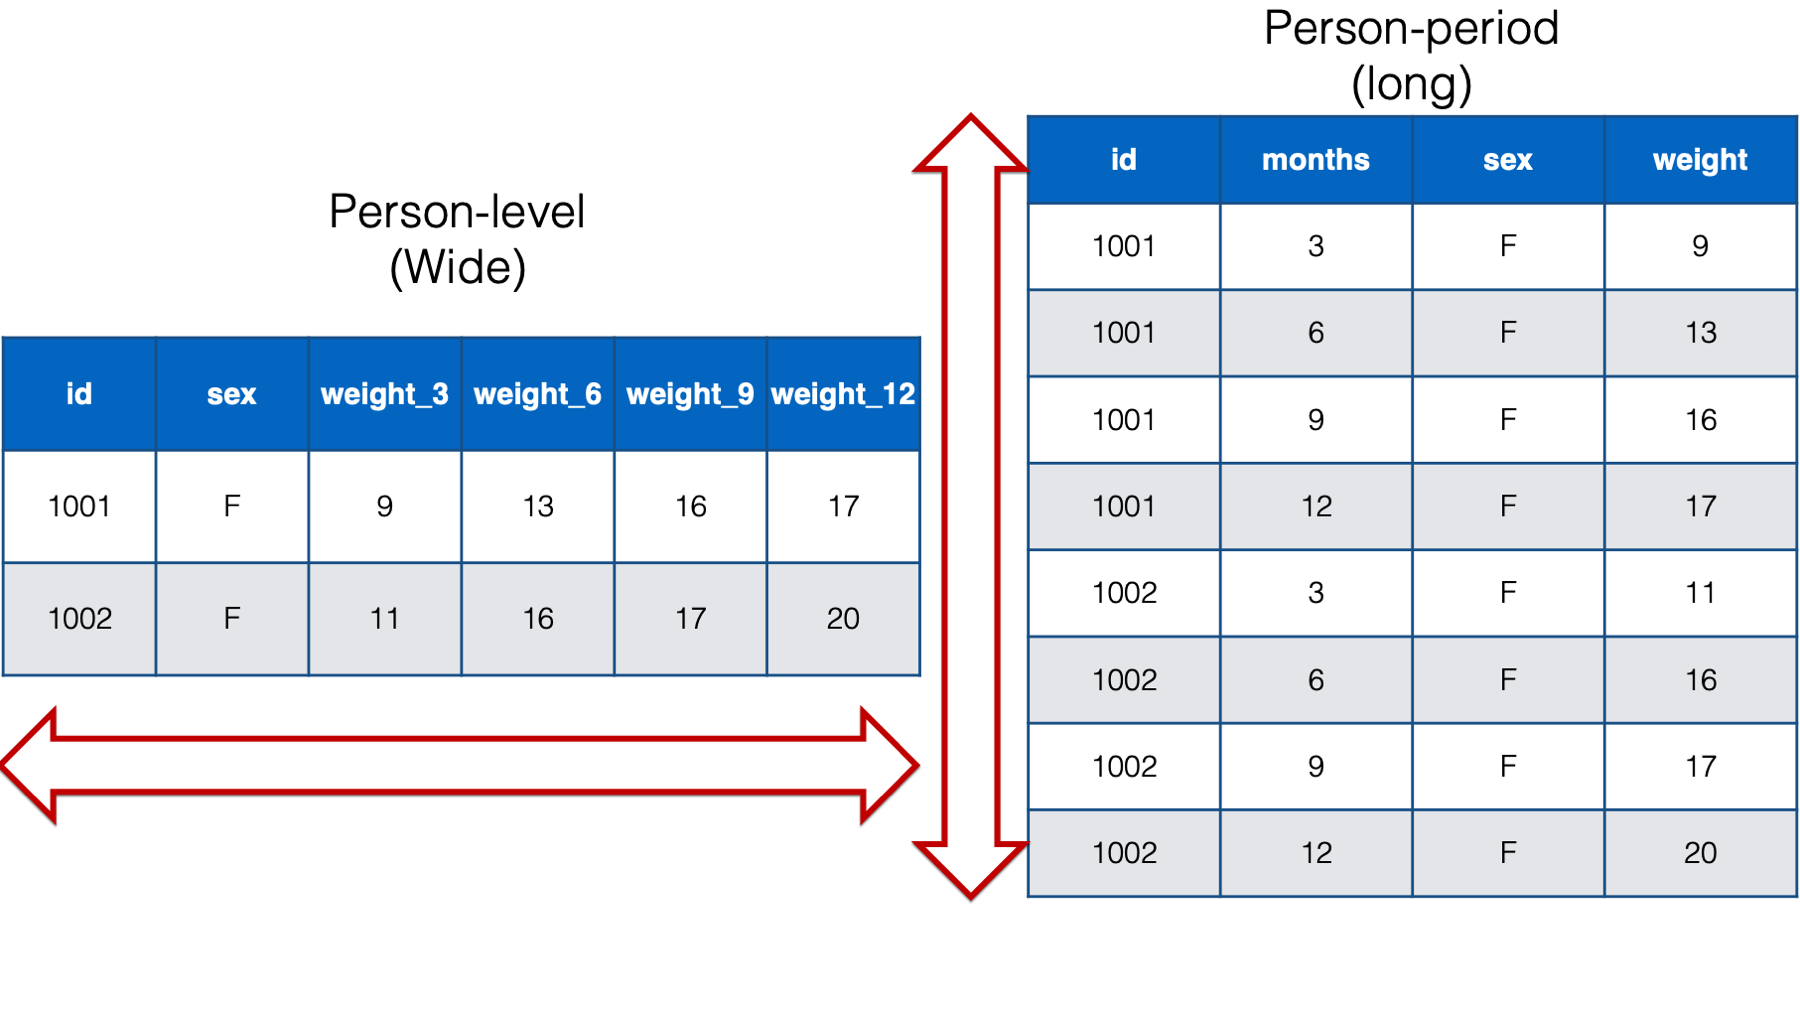
– Wide data contains values that do not repeat in the first column
– Long data contains values that do repeat in the first column

Data Format (Wide vs Long)
– Which have we typically used to create plots in this class?

Tidy Data
There are three interrelated rules that make a dataset tidy:
Each variable is a column; each column is a variable.
Each observation is row; each row is an observation.
Each value is a cell; each cell is a single value.
Motivation
– Sometimes, data are not in this format…
pivots
– pivot_longer
– pivot_wider
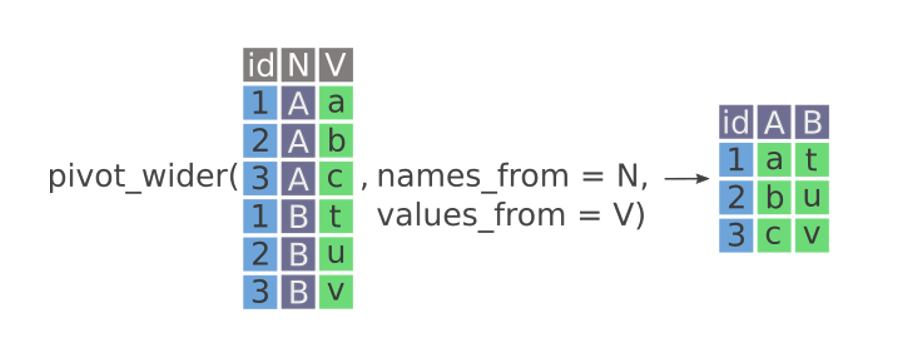
pivot_wider
pivot_wider
– Making tables for quick comparison / display purposes
– names_to
– values_to

Application exercise
Goal

Recap of AE
When pivoting longer, variable names that turn into values are characters by default. If you need them to be in another format, you need to explicitly make that transformation, which you can do so within the
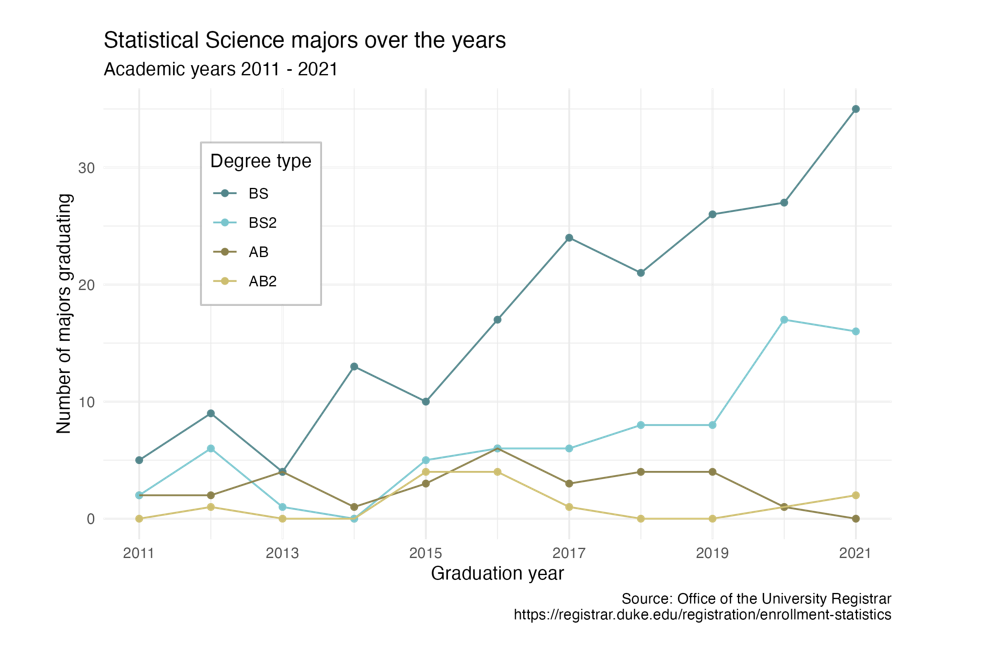
pivot_longer()function.You can tweak a plot forever, but at some point the tweaks are likely not very productive. However, you should always be critical of defaults (however pretty they might be) and see if you can improve the plot to better portray your data / results / what you want to communicate.
pivot_wider()which makes data sets wider by increasing columns and reducing rows.pivot_wider()has the opposite interface to pivot_longer(): we need to provide the existing columns that define the values (values_from) and the column name (names_from).
