Grammar of data wrangling
Lecture 4
Dr. Elijah Meyer
Duke University
STA 199 - Spring 2023
January 25, 2023
Checklist
– Clone your ae-03 repo (These will be graded starting today)
– Reminder: AEs due Saturday and Monday 11:59
– Be checking Slack!
Announcements
– HW1 is posted + starter repos created (Due Tuesday: Jan-31)
– Lab 1 is due Friday (Due Friday: Jan-27)
– Missing Repos? Post on Slack.
Slack Questions
In #discussions
– How to make plots show up in plotting tab
– How to get old versions of your document back
Slack Questions
Why are my changes not showing up in the Git tab?
– Are you saving?
– Are you in the correct project
Correct Project

Slack Questions
Don’t have permissions to clone / commit?
– Go back and follow Lab-0 instructions.
– See TA office hours. They will be happy to help!
Margins
In addition, the code should not exceed the 80 character limit, so that all the code can be read when you render to PDF. To help with this, you can add a vertical line at 80 characters by clicking “Tools” “Global Options” “Code” “Display”, then set “Margin Column” to 80, and click “Apply”.

Code Chunk Labels
– Informative names can help when navigating code.
– Informative names do not show up in Rendered documents (and that’s okay!)

Warm Up
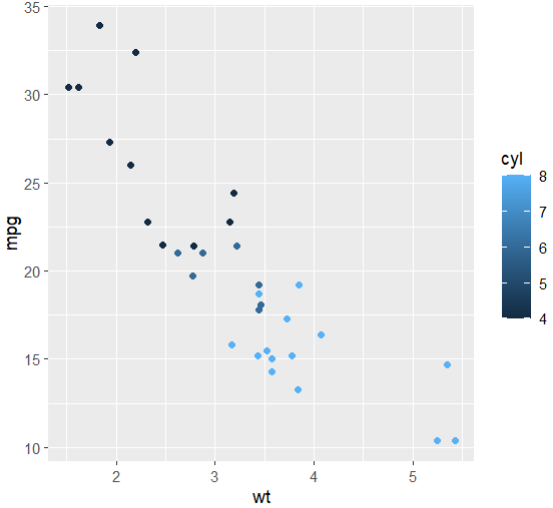
These data are from the mtcars data set. In R (or on a scratch piece of paper), practice writing out the code that would generate this plot below. Note: There are three values for cyl: 4, 6, 8.

Warm Up
How could we make this better?

Goals
Understand why we need to manipulate data
Calculate summary measures for data sets
Manipulate the format of data
Practice with tidyverse functions
Motivation: We live in a world of big data
– Calculating summary statistics becomes much harder when the data are large
– Often times, we want to “zoom in” to analyze what we want
Application exercise
ae-03-s23
Go to the course GitHub org and find your
ae-03-s23(repo name will be suffixed with your GitHub name).Clone the repo in your container, open the Quarto document in the repo, and follow along and complete the exercises.
Render, commit, and push your edits by the AE deadline – 3 days from today.
This is a long ae. Whatever we get through is what will be what’s due. We will finish the ae on Friday.
Recap of AE
We can transform data to learn more about what’s going on
Data are messy. This are valuable tools to tell the story you want
