AE-10 Probability II: Suggested Answers

Application exercise
── Attaching packages ─────────────────────────────────────── tidyverse 1.3.2 ──
✔ ggplot2 3.4.0     ✔ purrr   0.3.5
✔ tibble  3.1.8     ✔ dplyr   1.0.9
✔ tidyr   1.2.1     ✔ stringr 1.4.1
✔ readr   2.1.3     ✔ forcats 0.5.2
Warning: package 'ggplot2' was built under R version 4.2.2
Warning: package 'tidyr' was built under R version 4.2.2
Warning: package 'readr' was built under R version 4.2.2
Warning: package 'purrr' was built under R version 4.2.2
── Conflicts ────────────────────────────────────────── tidyverse_conflicts() ──
✖ dplyr::filter() masks stats::filter()
✖ dplyr::lag()    masks stats::lag()

Return of the Penguins

They are back! Please run the following code below to re-familiarize ourselves with these data. Data were collected and made available by Dr. Kristen Gorman and the Palmer Station, Antarctica LTER, a member of the Long Term Ecological Research Network.

data(penguins)

glimpse(penguins)
Rows: 344
Columns: 8
$ species           <fct> Adelie, Adelie, Adelie, Adelie, Adelie, Adelie, Adel…
$ island            <fct> Torgersen, Torgersen, Torgersen, Torgersen, Torgerse…
$ bill_length_mm    <dbl> 39.1, 39.5, 40.3, NA, 36.7, 39.3, 38.9, 39.2, 34.1, …
$ bill_depth_mm     <dbl> 18.7, 17.4, 18.0, NA, 19.3, 20.6, 17.8, 19.6, 18.1, …
$ flipper_length_mm <int> 181, 186, 195, NA, 193, 190, 181, 195, 193, 190, 186…
$ body_mass_g       <int> 3750, 3800, 3250, NA, 3450, 3650, 3625, 4675, 3475, …
$ sex               <fct> male, female, female, NA, female, male, female, male…
$ year              <int> 2007, 2007, 2007, 2007, 2007, 2007, 2007, 2007, 2007…
Remind yourself of your contingency table here:

penguins |>
  count(species, island) |>
  pivot_wider(names_from = species,
              values_from = n,
              values_fill = 0) |>
  kable()
island Adelie Chinstrap Gentoo
Biscoe 44 0 124
Dream 56 68 0
Torgersen 52 0 0

Sample Space

How large is the sample space of any penguin? Can we check this in R?

penguins |>
  count(island, species) |> 
  nrow()
[1] 5

And / Or probabilities

First, define your events below:

A - penguin is on Biscoe island

B - penguin is of the Adelie species

These are also called joint probabilities. Please answer the following questions below.

– What is the probability that a random penguin is on the Biscoe island and is of the Adelie species?

– What is the probability that a random penguin is on the Biscoe island or is of the Adelie species?

Steps

Perform the calculations in your console by typing the values out.

Next, confirm your calculations in R by writing code.

Hint: When calculating and or or probabilities… I suggest following these steps:

  • Create an indicator variable to match the events of your probability calculation

  • Take the mean of that variable

penguins |>
  mutate(ind = (species == "Adelie" & island == "Biscoe")) |>
  summarize(mean(ind))
# A tibble: 1 × 1
  `mean(ind)`
        <dbl>
1       0.128
penguins |>
  mutate(ind = (species == "Adelie" | island == "Biscoe")) |>
  summarize(mean(ind))
# A tibble: 1 × 1
  `mean(ind)`
        <dbl>
1       0.802

Conditional Probabilities

Conditional probability: The probability an event occurs given the other has occurred

– What is the probability that a random penguin is on the Biscoe island given the penguin of the Adelie species?

Hint: Create an appropriate table with count and filter. Next, create a new column that has the appropriate probability calculations. calculate the correct denominator using sum. colSums will produce an error within the function mutate. A more detailed explanation of this can be found in Slack.

penguins |>
  count(species, island) |>
  filter(species == "Adelie") |>
  mutate(prob = n / sum(n))
# A tibble: 3 × 4
  species island        n  prob
  <fct>   <fct>     <int> <dbl>
1 Adelie  Biscoe       44 0.289
2 Adelie  Dream        56 0.368
3 Adelie  Torgersen    52 0.342

Independence?

Are living on the Biscoe island and being an Adelie species independent events? Justify your answer?

No: The probability of being on the Biscoe island, given the penguin is of the Adlie speices is not equal to just the probability of being on the Biscoe island.

Computer Store

To assess our understanding of probability, we will practice filling in a table based on a couple given values.

In a computer store, 30% of the computers in stock are laptops and 70% are desktops. Five percent of the laptops are on sale, while 10% of the desktops are on sale. Assume that the table total is 1000.

A - A computer is on sale

B - Is a desktop

data <- tibble( 
  Type = c("Desktop", "Desktop" , "Laptop" , "Laptop"),
  Sale = c("Sale", "No-Sale" , "Sale", "No-Sale"),
  values = c(70,630,15,285) #change code here
  )

data |>
  pivot_wider( 
    names_from = Type,
    values_from = values)

Extension Question (Only if time)

Bike sharing systems are new generation of traditional bike rentals where whole process from membership, rental and return back has become automatic. You are tasked to investigate the relationship between the temperature outside and the number of bikes rented in the Washington DC area between the years 2011 and 2022. You will be investigating data for the months June, July, September, and November.

Simpson’s Paradox

bike <- read_csv("data/bike.csv")
Rows: 242 Columns: 7
── Column specification ────────────────────────────────────────────────────────
Delimiter: ","
dbl (7): season, yr, mnth, holiday, weekday, temp, cnt

ℹ Use `spec()` to retrieve the full column specification for this data.
ℹ Specify the column types or set `show_col_types = FALSE` to quiet this message.

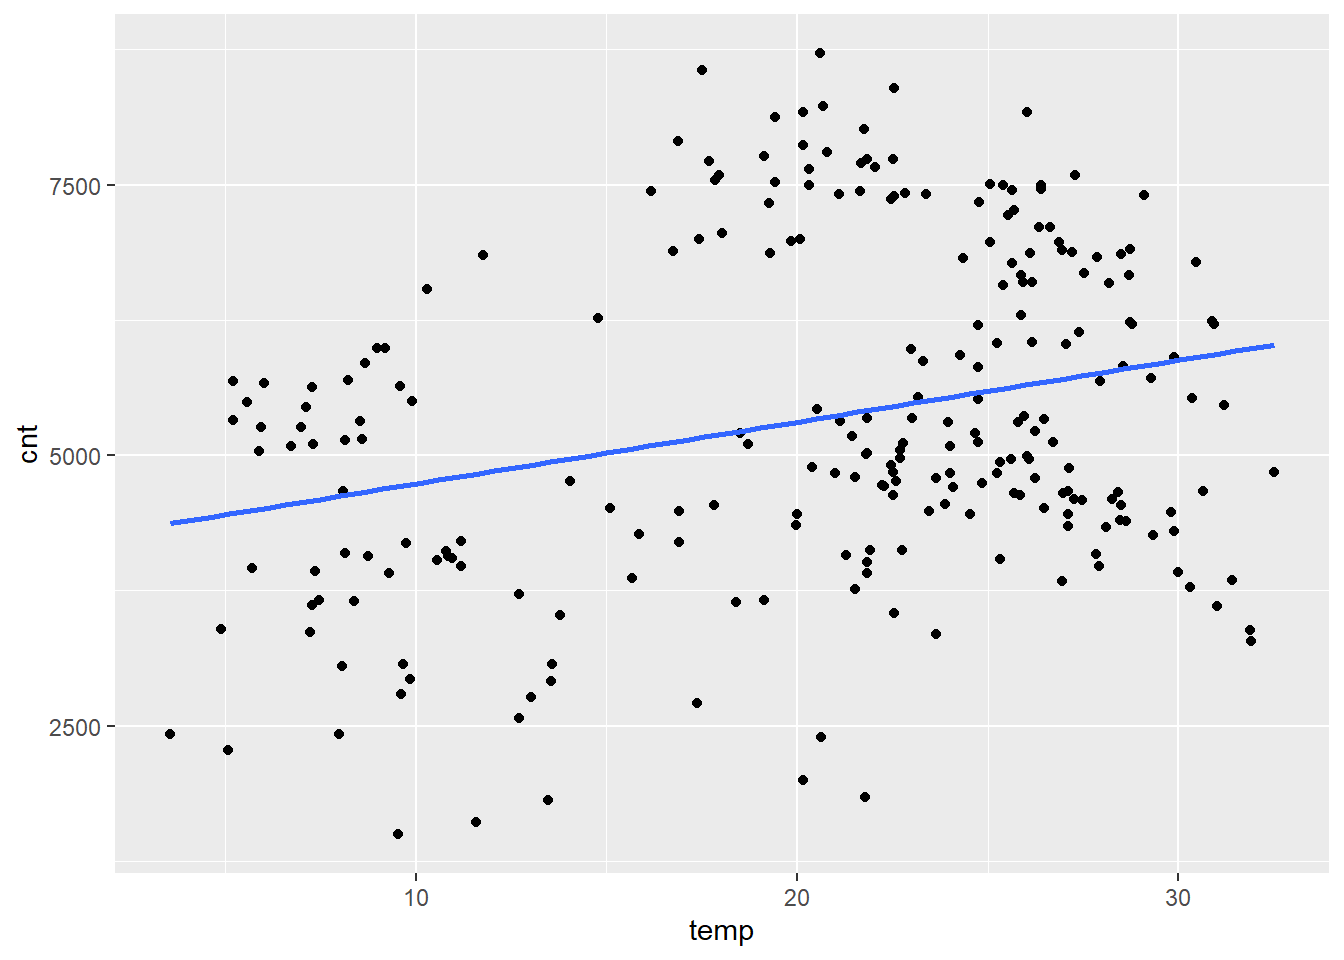
– Create a scatter plot that investigates the relationship between the number of bikes rented and the temperature outside. Include a straight line of best fit to help discuss the discovered relationship. Summarize your findings.

bike |> 
  ggplot(
    aes(y = cnt , x = temp)
  ) + 
  geom_point() + 
  geom_smooth(method = "lm" , se = FALSE)
`geom_smooth()` using formula = 'y ~ x'

This scatter plot would suggest a positive relationship between count and temperature.

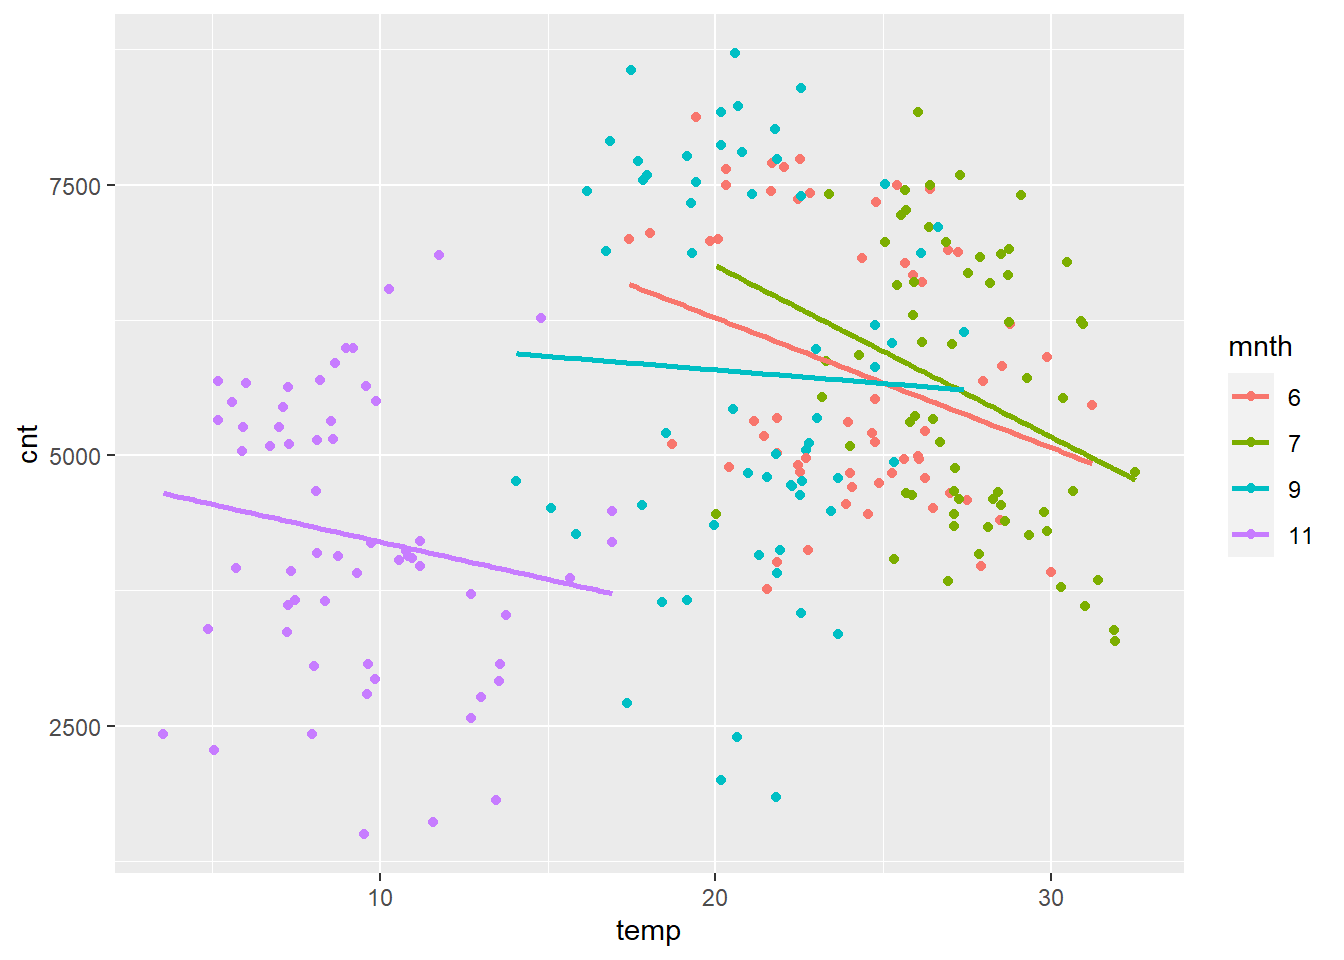
– Another researcher suggests to look at the relationship between bikes rented and temperature by each of the four months of interest. Recreate your plot in part a, and color the points by month. Include a straight line for each of the four months to help discuss each month’s relationship between bikes rented and temperature. In 3-4 sentences, summarize your findings.

bike |> 
  mutate(mnth = as.factor(mnth)) |> 
  ggplot(
    aes(y = cnt, x = temp, color = mnth)
  ) + 
  geom_point() +
  geom_smooth(method = "lm" , se = FALSE)
`geom_smooth()` using formula = 'y ~ x'

Now that our data are grouped by month, we see four varying negative trends between count and temperature by month. This is vastly different of a story vs the ungrouped data.

For more information on Simpson’s Paradox, please watch the following video on Simpson’s Paradox here.